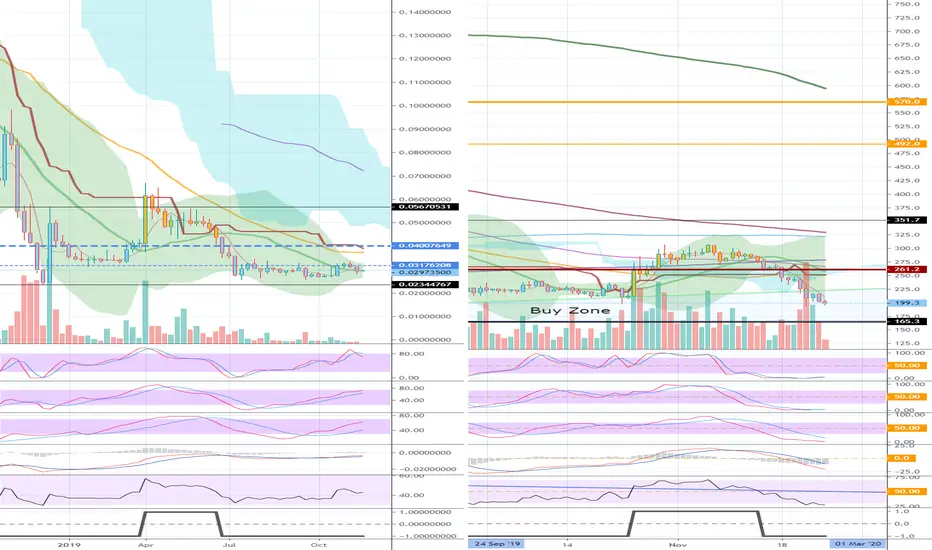
[Chart of BCHBTC]
If it falls, you are likely to touch the 0.02344767 point.
If it rises, it is likely to challenge the 0.03176208 point, and if the price holds, it is likely to challenge the 0.04007649 point.
You can see that the price is located near the bottom of the midpoint (0.04007649) within the large box section between 0.02344767 and 0.05670531.
[Chart of BCHUSD]
The price fell as the upward trendline broke.
The 165.3 branch divides the medium and long term investment areas.
The current position is a possible section when you slowly divide and rise into a buyable section.
We should check if we can rise above the upward trend line and cross 261.2.

[Practical trading strategy using HA-MS and SBOD]
youtu.be/aceN1AttX1Y
youtu.be/aceN1AttX1Y
相關出版品
免責聲明
這些資訊和出版物並非旨在提供,也不構成TradingView提供或認可的任何形式的財務、投資、交易或其他類型的建議或推薦。請閱讀使用條款以了解更多資訊。
[Practical trading strategy using HA-MS and SBOD]
youtu.be/aceN1AttX1Y
youtu.be/aceN1AttX1Y
相關出版品
免責聲明
這些資訊和出版物並非旨在提供,也不構成TradingView提供或認可的任何形式的財務、投資、交易或其他類型的建議或推薦。請閱讀使用條款以了解更多資訊。