
Trend Analysis
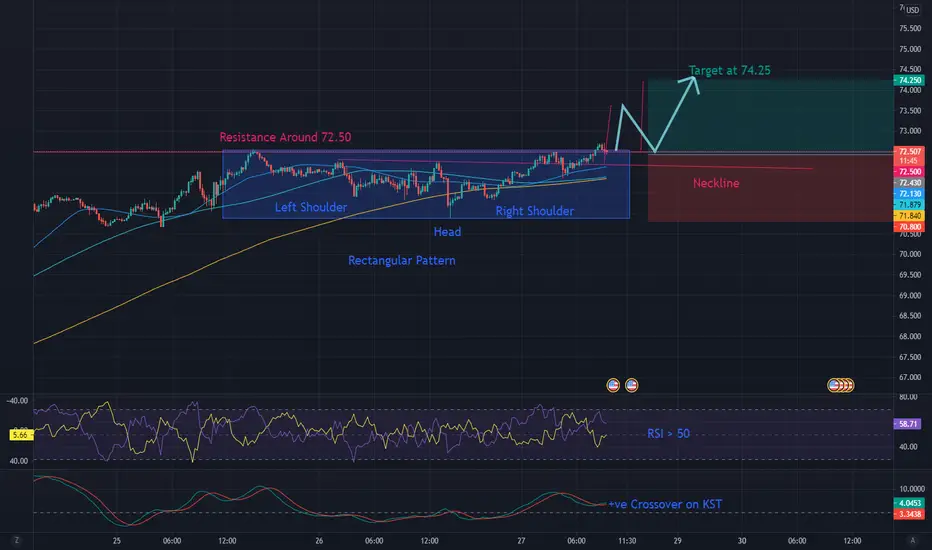
The main view of this trade idea is on the 15-Min Chart. The consolidation in Brent Crude Oil over the last couple of days has produced 2 chart pattern setups, a Rectangle as well as a Reverse Head and Shoulders. Resistance for the Rectangle is around the 72.50 price level while support is seen at the 70.85 price level, which is also the Head of the Head and Shoulders pattern. The Left and Right Shoulders are around the 71.35 price level while the Neckline is around the 72.30 resistance. The completion of these chart patterns will take the commodity between 73.65 and 74.25.
Technical Indicators
Brent Crude Oil is trending higher as it is currently above its short (25-MA), medium (75-MA) and long (200-MA) fractal moving averages. Also the short MA is above both the medium and long term MA and the medium term MA is above the long term MA. This denotes an uptrend over the respective timeframe. The RSI is above 50 and there has been a positive crossover on the KST.
Recommendation
The recommendation will be to go long at market. Stop loss will be set around the 70.80 price level and a target of 74.25. This produces a risk-reward ratio of 1.12.
Disclaimer
The views expressed are mine and do not represent the views of my employers and business partners. Persons acting on these recommendations are doing so at their own risk. These recommendations are not a solicitation to buy or to sell but are for purely discussion purposes. At the time publishing, I have a position in Brent Crude Oil.
The main view of this trade idea is on the 15-Min Chart. The consolidation in Brent Crude Oil over the last couple of days has produced 2 chart pattern setups, a Rectangle as well as a Reverse Head and Shoulders. Resistance for the Rectangle is around the 72.50 price level while support is seen at the 70.85 price level, which is also the Head of the Head and Shoulders pattern. The Left and Right Shoulders are around the 71.35 price level while the Neckline is around the 72.30 resistance. The completion of these chart patterns will take the commodity between 73.65 and 74.25.
Technical Indicators
Brent Crude Oil is trending higher as it is currently above its short (25-MA), medium (75-MA) and long (200-MA) fractal moving averages. Also the short MA is above both the medium and long term MA and the medium term MA is above the long term MA. This denotes an uptrend over the respective timeframe. The RSI is above 50 and there has been a positive crossover on the KST.
Recommendation
The recommendation will be to go long at market. Stop loss will be set around the 70.80 price level and a target of 74.25. This produces a risk-reward ratio of 1.12.
Disclaimer
The views expressed are mine and do not represent the views of my employers and business partners. Persons acting on these recommendations are doing so at their own risk. These recommendations are not a solicitation to buy or to sell but are for purely discussion purposes. At the time publishing, I have a position in Brent Crude Oil.
交易結束:目標達成
Target Met. Investors and traders should move their stop loss to break even and monitor for a change in trend.
免責聲明
這些資訊和出版物並非旨在提供,也不構成TradingView提供或認可的任何形式的財務、投資、交易或其他類型的建議或推薦。請閱讀使用條款以了解更多資訊。