
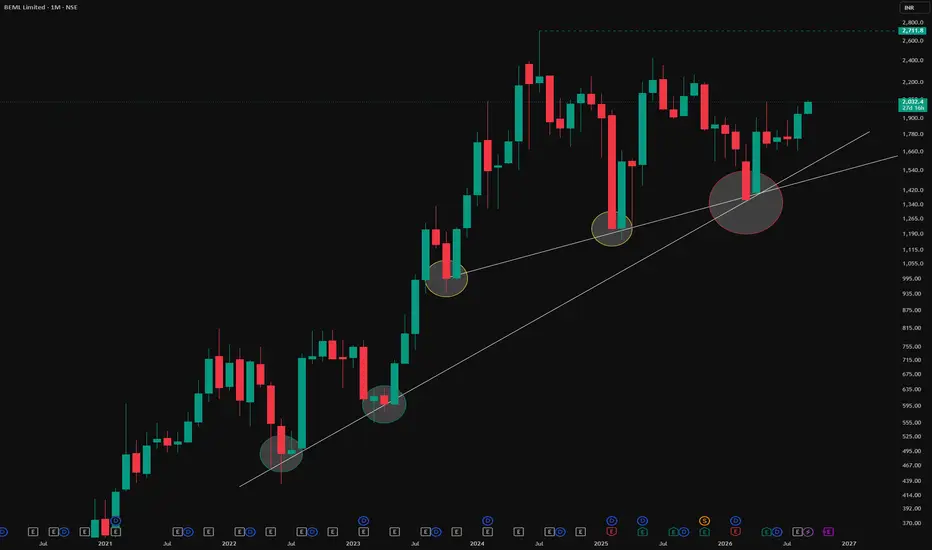
This post is educational and observational in nature based on historical price action on the monthly timeframe. It is not a forecast or a trading recommendation.Using older than 3 months charts
The Two Trendlines
Two separate trendlines have been drawn on the monthly timeframe. The smaller green circles mark the touchpoints of the first trendline, while the smaller yellow circles mark the touchpoints of the second, each line independently respected by price across its own set of touches.
The Confluence Point
The larger red circle marks the exact intersection of these two trendlines. A few months back, price reacted right at this intersection, an area where two independently drawn trendlines happened to meet. When separate technical references align at the same location, this is referred to as trendline confluence, and price respecting that exact point adds meaningful weight to the observation.
The Two Trendlines
Two separate trendlines have been drawn on the monthly timeframe. The smaller green circles mark the touchpoints of the first trendline, while the smaller yellow circles mark the touchpoints of the second, each line independently respected by price across its own set of touches.
The Confluence Point
The larger red circle marks the exact intersection of these two trendlines. A few months back, price reacted right at this intersection, an area where two independently drawn trendlines happened to meet. When separate technical references align at the same location, this is referred to as trendline confluence, and price respecting that exact point adds meaningful weight to the observation.

📊Swing & positional research with Buy, Sell & Hold recommendations
Contact for NOVEMBER SLOTS
📞WhatsApp: wa.me/919455664601
📢Free Picks on Telegram : t.me/hashtaghammer
Apoorv Dubey|SEBI RA INH000030287
Contact for NOVEMBER SLOTS
📞WhatsApp: wa.me/919455664601
📢Free Picks on Telegram : t.me/hashtaghammer
Apoorv Dubey|SEBI RA INH000030287
相關出版品
免責聲明
這些資訊和出版物並非旨在提供,也不構成TradingView提供或認可的任何形式的財務、投資、交易或其他類型的建議或推薦。請閱讀使用條款以了解更多資訊。
📊Swing & positional research with Buy, Sell & Hold recommendations
Contact for NOVEMBER SLOTS
📞WhatsApp: wa.me/919455664601
📢Free Picks on Telegram : t.me/hashtaghammer
Apoorv Dubey|SEBI RA INH000030287
Contact for NOVEMBER SLOTS
📞WhatsApp: wa.me/919455664601
📢Free Picks on Telegram : t.me/hashtaghammer
Apoorv Dubey|SEBI RA INH000030287
相關出版品
免責聲明
這些資訊和出版物並非旨在提供,也不構成TradingView提供或認可的任何形式的財務、投資、交易或其他類型的建議或推薦。請閱讀使用條款以了解更多資訊。