
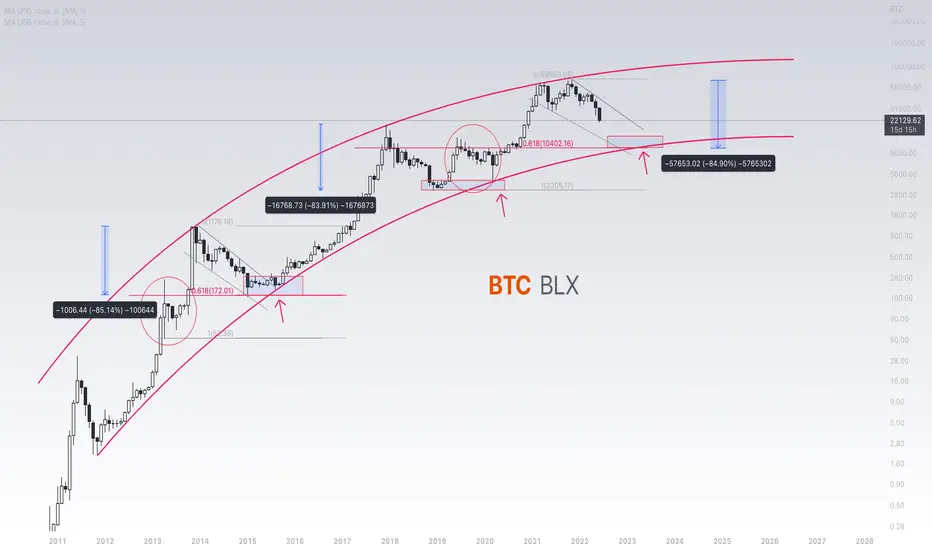
Here's a scenario to look at. I know the curved lines are subjective, but look at the circled part of the chart and the PA that followed after. Im referring to 2013 -2015
We've already seen ETH drop below it's previous ATH and we may see something similar for BTC with a touch of the macro 0.618 fib at around 10k. The 0.5 fib is around 14k so im speculating on a price within this range.
10k would also equate to a 84% drop which has been the trend for BTC whenever it hits its top in the previous 2x
Let's see how this goes
We've already seen ETH drop below it's previous ATH and we may see something similar for BTC with a touch of the macro 0.618 fib at around 10k. The 0.5 fib is around 14k so im speculating on a price within this range.
10k would also equate to a 84% drop which has been the trend for BTC whenever it hits its top in the previous 2x
Let's see how this goes

免責聲明
這些資訊和出版物並非旨在提供,也不構成TradingView提供或認可的任何形式的財務、投資、交易或其他類型的建議或推薦。請閱讀使用條款以了解更多資訊。