
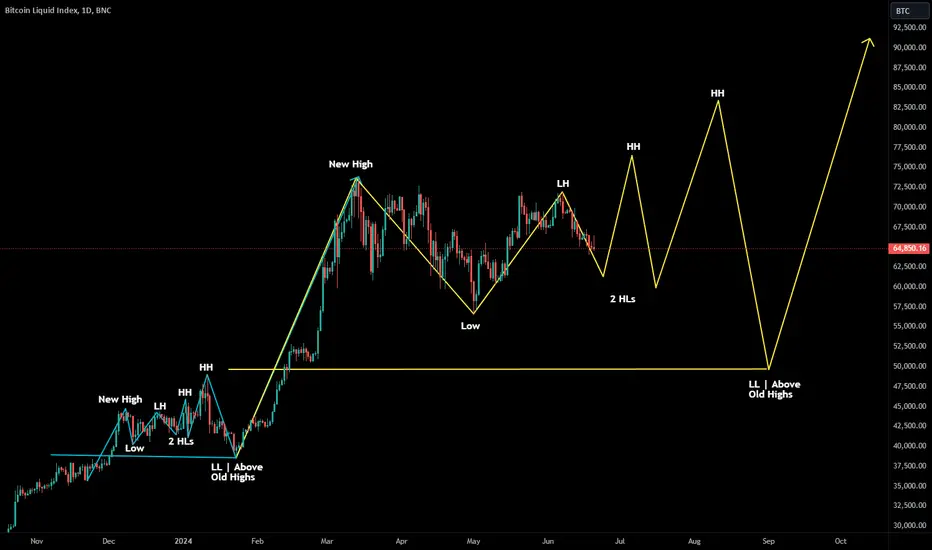
Here's an idea I haven't seen proposed. What if we're repeating the same pattern we saw between approx 40-50k, on a higher timeframe and between 50-85k.
Just like the blue pattern before it, it starts with a new high being made, then a low well above old highs, then a lower high followed by a higher low, then a higher high followed by a 2nd higher low (slightly lower than the previous higher low), finally a 3rd and significantly higher high followed be a strong lower low but still above old highs prior to the new high.
Let's see if it happens again!
Just like the blue pattern before it, it starts with a new high being made, then a low well above old highs, then a lower high followed by a higher low, then a higher high followed by a 2nd higher low (slightly lower than the previous higher low), finally a 3rd and significantly higher high followed be a strong lower low but still above old highs prior to the new high.
Let's see if it happens again!

免責聲明
這些資訊和出版物並非旨在提供,也不構成TradingView提供或認可的任何形式的財務、投資、交易或其他類型的建議或推薦。請閱讀使用條款以了解更多資訊。
免責聲明
這些資訊和出版物並非旨在提供,也不構成TradingView提供或認可的任何形式的財務、投資、交易或其他類型的建議或推薦。請閱讀使用條款以了解更多資訊。