
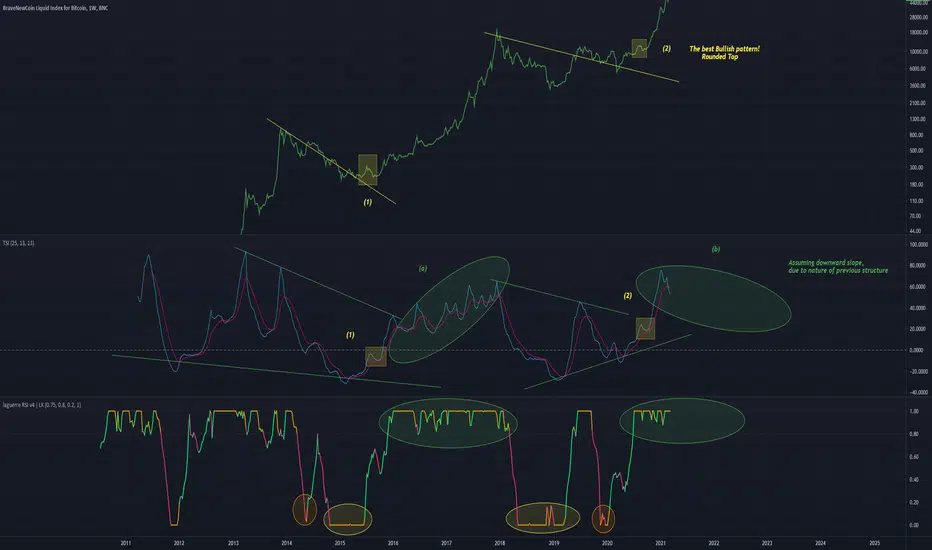
An idea using more indicators than usual
Patterns within TSI can be identified, assume that the 2017 parabola repeats (green circle on TSI)
Rounded top can be seen to produce consistent results throughout the history of BTC
My gut tells me that another 2017 parabolic wont occur again, and the different in structures on these indicators will account for that
I still believe Ethereum has a lot more potential for long term returns than BTC, and ill keep believing that until it eventuates.

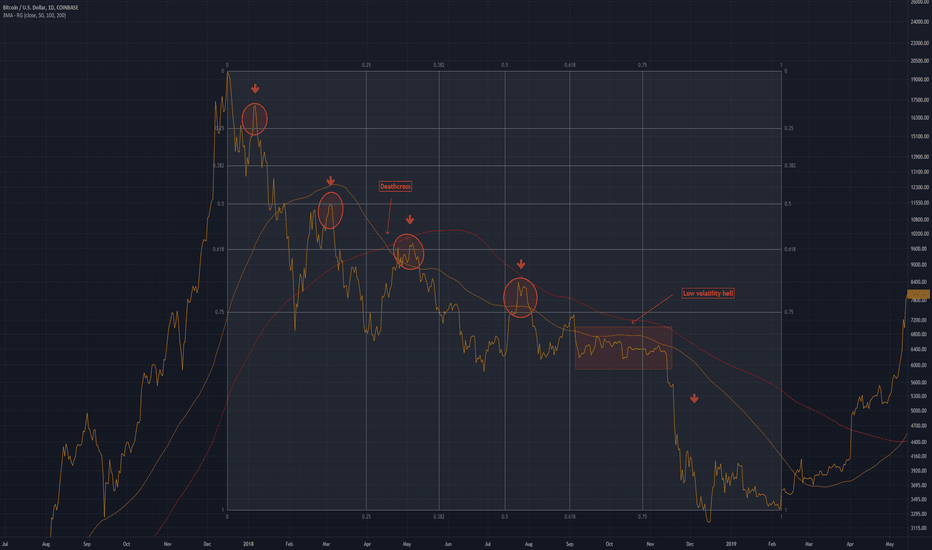
Above is an analysis of the 2018 Bear Market for BTC
Patterns within TSI can be identified, assume that the 2017 parabola repeats (green circle on TSI)
Rounded top can be seen to produce consistent results throughout the history of BTC
My gut tells me that another 2017 parabolic wont occur again, and the different in structures on these indicators will account for that
I still believe Ethereum has a lot more potential for long term returns than BTC, and ill keep believing that until it eventuates.
Above is an analysis of the 2018 Bear Market for BTC

免責聲明
這些資訊和出版物並非旨在提供,也不構成TradingView提供或認可的任何形式的財務、投資、交易或其他類型的建議或推薦。請閱讀使用條款以了解更多資訊。