
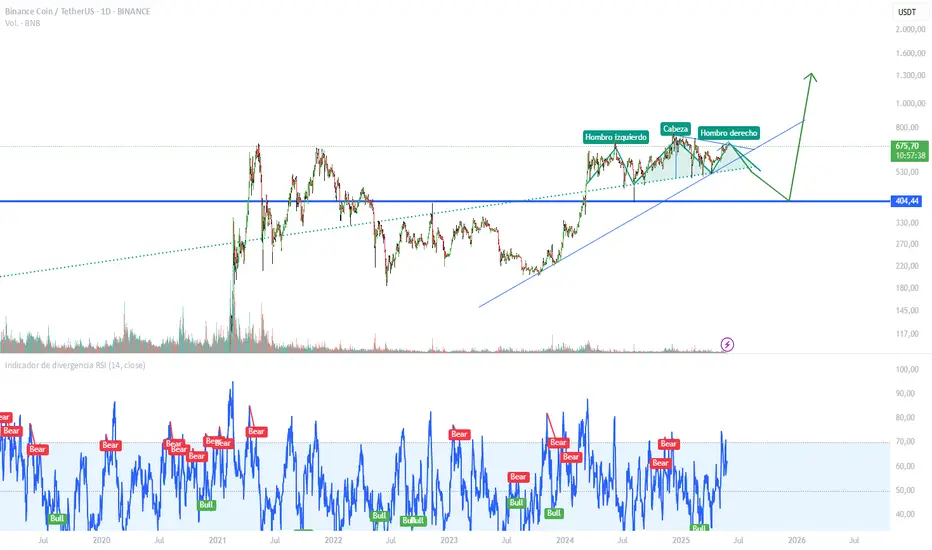
The BNB/USDT daily chart appears to be forming a classic Head and Shoulders (H&S) topping pattern, signaling a potential bearish reversal after its significant uptrend. The structure clearly defines a "Left Shoulder," a higher "Head" (peaking near $800), and a subsequent "Right Shoulder" that aligns in height with the left. The critical element is the upward-sloping neckline, defined by the trendline connecting the lows between the shoulders.
A confirmed breakdown below this neckline, ideally supported by increased selling volume, would validate the H&S pattern. The traditional price target for this pattern is calculated by measuring the vertical distance from the Head's peak to the neckline and projecting it downwards from the breakout point. This suggests a potential downside move towards the significant horizontal support around the $404.44 level, or even lower, as indicated by the chart's projection. Traders would monitor volume profile and RSI behavior for confirmation of the breakout, as a decisive close below the neckline would strongly indicate a shift from bullish momentum to a protracted bearish phase.
A confirmed breakdown below this neckline, ideally supported by increased selling volume, would validate the H&S pattern. The traditional price target for this pattern is calculated by measuring the vertical distance from the Head's peak to the neckline and projecting it downwards from the breakout point. This suggests a potential downside move towards the significant horizontal support around the $404.44 level, or even lower, as indicated by the chart's projection. Traders would monitor volume profile and RSI behavior for confirmation of the breakout, as a decisive close below the neckline would strongly indicate a shift from bullish momentum to a protracted bearish phase.
交易進行

免責聲明
這些資訊和出版物並非旨在提供,也不構成TradingView提供或認可的任何形式的財務、投資、交易或其他類型的建議或推薦。請閱讀使用條款以了解更多資訊。