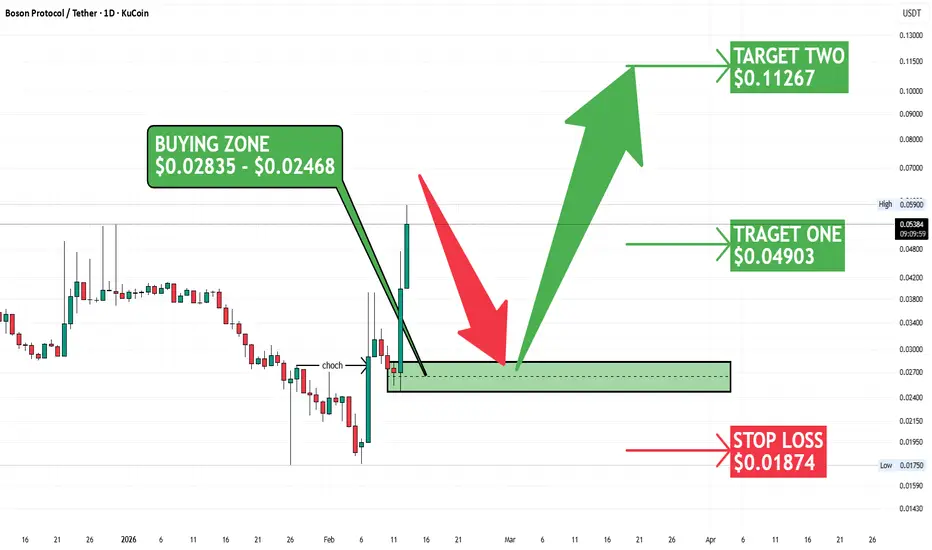

 BOSONUSDT is showing a bullish reversal and continuation setup after a strong impulsive breakout from a prolonged downtrend. Price has formed a clear demand zone after a change of character (CHOCH) and is expected to retest support before continuing upward momentum.
🟢 Market Structure & Price Action
Price previously traded in a sustained downtrend with lower highs and lower lows.
A strong impulsive bullish move caused a change of character (CHOCH), signaling a potential trend reversal.
After the breakout, price is expected to retrace into the highlighted buying zone ($0.02835 – $0.02468), which is acting as a strong demand area where buyers may step in.
🎯 Trade Setup
Entry Zone: $0.02835 – $0.02468 (key demand support)
Stop Loss: $0.01874 (below demand zone to manage downside risk)
Target 1: $0.04903 (near-term resistance level)
Target 2: $0.11267 (major bullish expansion target)
📈 Technical Outlook
Holding above the demand zone keeps the bullish structure intact and confirms reversal strength.
A bounce from the support area could trigger strong upside continuation toward resistance targets.
A breakdown below $0.02468 would weaken the bullish bias and may lead to further downside.
✅ Overall Bias: Bullish above demand zone with strong reversal potential if support holds.

免責聲明
這些資訊和出版物並非旨在提供,也不構成TradingView提供或認可的任何形式的財務、投資、交易或其他類型的建議或推薦。請閱讀使用條款以了解更多資訊。
免責聲明
這些資訊和出版物並非旨在提供,也不構成TradingView提供或認可的任何形式的財務、投資、交易或其他類型的建議或推薦。請閱讀使用條款以了解更多資訊。