
1. Big Picture (Market Context)
BPCL was earlier in a downtrend, making lower highs and lower lows.
The price formed a base after heavy selling — this usually signals selling exhaustion.
2. Wyckoff Accumulation Structure
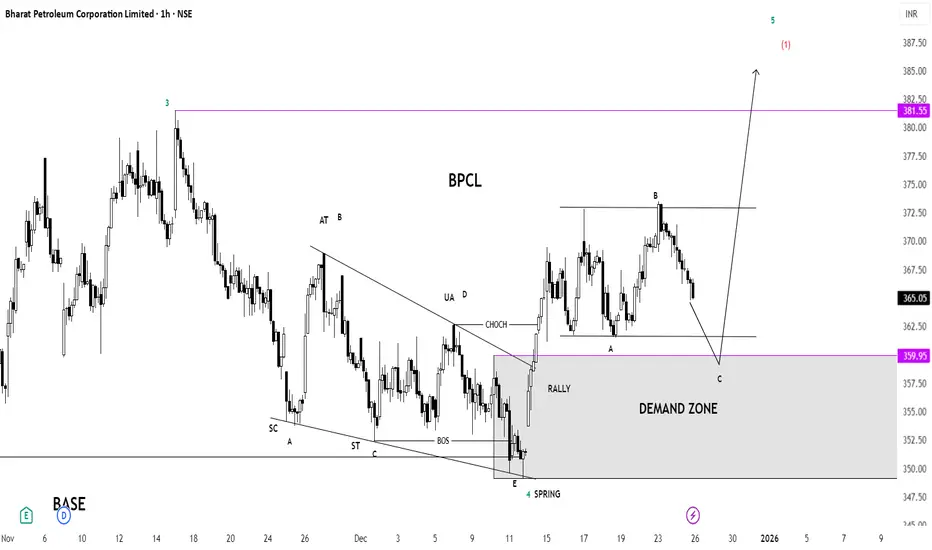
Your chart clearly shows a Wyckoff Accumulation:
SC (Selling Climax): Strong selling pressure near the bottom.
ST (Secondary Test): Price retested the lows with less selling — bearish strength weakening.
Spring (Point E):
Price briefly broke below support.
This is a liquidity grab to trap sellers.
Strong Rally after Spring: Confirms smart money accumulation.
➡️ This structure signals a trend reversal from bearish to bullish.
3. BOS & CHOCH (Smart Money Concepts)
BOS (Break of Structure): Confirms bullish intent.
CHOCH (Change of Character): Market shifts from selling rallies to buying dips.
These two together strongly confirm a bullish reversal.
4. Demand Zone (Key Buy Area)
Grey zone between ₹350–₹360 is the Demand Zone.
Price is currently pulling back toward this zone.
This area is expected to act as support.
👉 If price shows bullish candles here, it becomes a high-probability buy zone.
5. Current Price Action (A-B-C)
A: First support after rally.
B: Lower high / resistance area.
C: Expected final dip into demand zone.
This is a healthy pullback, not weakness.
6. Resistance & Targets
Immediate Resistance:
₹372–₹375 (previous high B)
Major Target:
₹381–₹385 (liquidity & resistance line)
If this breaks, momentum can push price toward ₹387–₹390+
7. Expected Move (Simple Flow)
Small dip into demand zone (₹350–₹360)
Buyers step in
Break above ₹375
Rally toward ₹381–₹385
8. Bullish Confirmation to Watch
Strong bullish candle from demand zone
Volume expansion on breakout
Hourly close above ₹375
Summary (Quick View)
Trend: Turning Bullish
Structure: Wyckoff Accumulation + BOS + CHOCH
Buy Zone: ₹350–₹360 (with confirmation)
Target: ₹381–₹385
Timeframe: Intraday / Short-term Swing
BPCL was earlier in a downtrend, making lower highs and lower lows.
The price formed a base after heavy selling — this usually signals selling exhaustion.
2. Wyckoff Accumulation Structure
Your chart clearly shows a Wyckoff Accumulation:
SC (Selling Climax): Strong selling pressure near the bottom.
ST (Secondary Test): Price retested the lows with less selling — bearish strength weakening.
Spring (Point E):
Price briefly broke below support.
This is a liquidity grab to trap sellers.
Strong Rally after Spring: Confirms smart money accumulation.
➡️ This structure signals a trend reversal from bearish to bullish.
3. BOS & CHOCH (Smart Money Concepts)
BOS (Break of Structure): Confirms bullish intent.
CHOCH (Change of Character): Market shifts from selling rallies to buying dips.
These two together strongly confirm a bullish reversal.
4. Demand Zone (Key Buy Area)
Grey zone between ₹350–₹360 is the Demand Zone.
Price is currently pulling back toward this zone.
This area is expected to act as support.
👉 If price shows bullish candles here, it becomes a high-probability buy zone.
5. Current Price Action (A-B-C)
A: First support after rally.
B: Lower high / resistance area.
C: Expected final dip into demand zone.
This is a healthy pullback, not weakness.
6. Resistance & Targets
Immediate Resistance:
₹372–₹375 (previous high B)
Major Target:
₹381–₹385 (liquidity & resistance line)
If this breaks, momentum can push price toward ₹387–₹390+
7. Expected Move (Simple Flow)
Small dip into demand zone (₹350–₹360)
Buyers step in
Break above ₹375
Rally toward ₹381–₹385
8. Bullish Confirmation to Watch
Strong bullish candle from demand zone
Volume expansion on breakout
Hourly close above ₹375
Summary (Quick View)
Trend: Turning Bullish
Structure: Wyckoff Accumulation + BOS + CHOCH
Buy Zone: ₹350–₹360 (with confirmation)
Target: ₹381–₹385
Timeframe: Intraday / Short-term Swing

免責聲明
這些資訊和出版物並非旨在提供,也不構成TradingView提供或認可的任何形式的財務、投資、交易或其他類型的建議或推薦。請閱讀使用條款以了解更多資訊。
免責聲明
這些資訊和出版物並非旨在提供,也不構成TradingView提供或認可的任何形式的財務、投資、交易或其他類型的建議或推薦。請閱讀使用條款以了解更多資訊。