
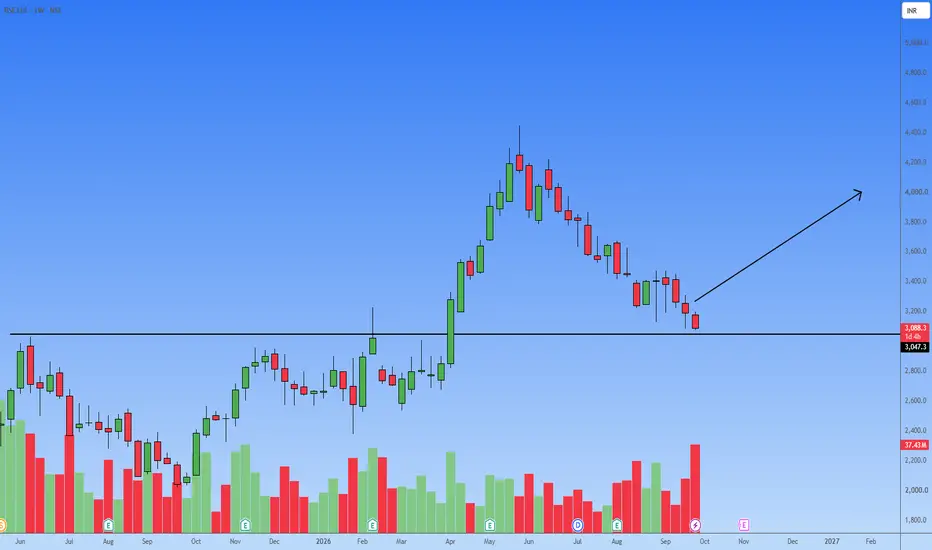
The weekly chart for BSE Ltd. illustrates a classic technical setup a retest of a major breakout level.
The distinct horizontal line plotted at 3047.3 highlights a significant previous resistance zone that capped the price action in late 2023 and early 2024.
Following a decisive breakout above this level in April, the stock experienced a strong rally. Currently, the price has corrected sharply from its highs and is testing the 3047–3086 region.
According to the principle of polarity in technical analysis, broken resistance often turns into new support.
This makes the current level a highly critical area to monitor for a potential base formation and trend continuation.
Trading Plan:
Entry Point: The ideal entry zone lies between the 3040 and 3100 levels, right at the retest of the horizontal support line.
Before entering, it is best practice to look for confirmation of support holding on a lower timeframe (like a daily bullish reversal candlestick pattern) to ensure buying momentum is returning.
Stop Loss: To manage risk effectively, a strict stop loss should be placed below the structural support.
A weekly close below 2950 would indicate that the breakout retest has failed and the previous resistance was a bull trap, invalidating the setup.
Targets: If the support holds and the upward trend resumes, the logical upside targets based on previous market structure are:
Target 1: 3600 (First major swing high on the way down)
Target 2: 4000 (Psychological round number and secondary resistance)
Target 3: 4400 (Retest of the peak highs visible on the chart)
The distinct horizontal line plotted at 3047.3 highlights a significant previous resistance zone that capped the price action in late 2023 and early 2024.
Following a decisive breakout above this level in April, the stock experienced a strong rally. Currently, the price has corrected sharply from its highs and is testing the 3047–3086 region.
According to the principle of polarity in technical analysis, broken resistance often turns into new support.
This makes the current level a highly critical area to monitor for a potential base formation and trend continuation.
Trading Plan:
Entry Point: The ideal entry zone lies between the 3040 and 3100 levels, right at the retest of the horizontal support line.
Before entering, it is best practice to look for confirmation of support holding on a lower timeframe (like a daily bullish reversal candlestick pattern) to ensure buying momentum is returning.
Stop Loss: To manage risk effectively, a strict stop loss should be placed below the structural support.
A weekly close below 2950 would indicate that the breakout retest has failed and the previous resistance was a bull trap, invalidating the setup.
Targets: If the support holds and the upward trend resumes, the logical upside targets based on previous market structure are:
Target 1: 3600 (First major swing high on the way down)
Target 2: 4000 (Psychological round number and secondary resistance)
Target 3: 4400 (Retest of the peak highs visible on the chart)

免責聲明
這些資訊和出版物並非旨在提供,也不構成TradingView提供或認可的任何形式的財務、投資、交易或其他類型的建議或推薦。請閱讀使用條款以了解更多資訊。
免責聲明
這些資訊和出版物並非旨在提供,也不構成TradingView提供或認可的任何形式的財務、投資、交易或其他類型的建議或推薦。請閱讀使用條款以了解更多資訊。