
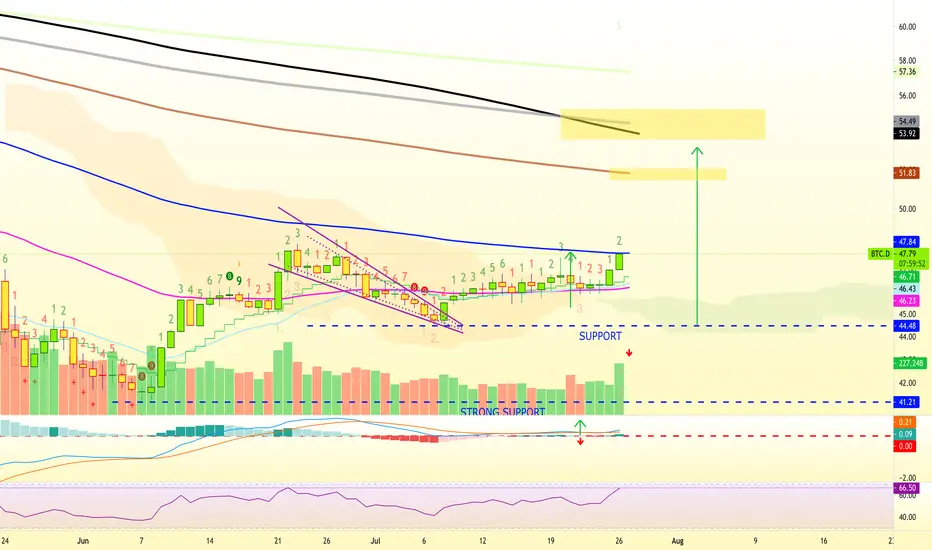
Recently I shared a chart for Bitcoin Dominance (BTC.D).
Here is a follow up, short and simple...
I believe this chart will continue climbing until reaching 50 and higher.
The indicators, RSI and MACD, as well as the volume bars and the candles (candlestick reading) support this.
Previous chart: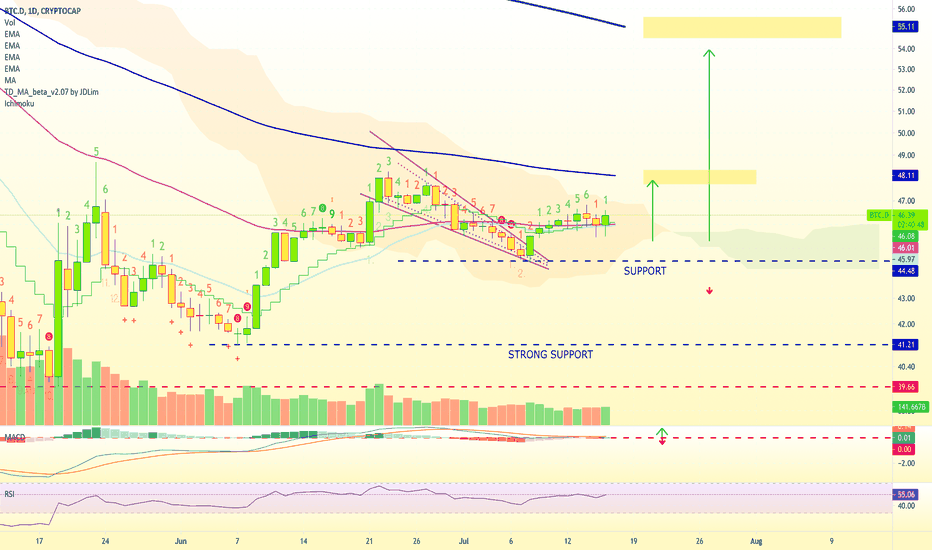
Remember to hit LIKE and leave a comment.
Namaste.
Here is a follow up, short and simple...
I believe this chart will continue climbing until reaching 50 and higher.
The indicators, RSI and MACD, as well as the volume bars and the candles (candlestick reading) support this.
Previous chart:
Remember to hit LIKE and leave a comment.
Namaste.
註釋
BTC.D closed daily to the upside above EMA100.It is the first time this happens since October 2020.
This is a strong bullish signal, specially if it can stay above this level.
EMA100 here is represented by the blue line on the chart.

💯 Trading signals (results)
— Late 2026👇
t.me/masteranandatrades/9279
🔥 10-25X Leverage
—Trade-numbers:
t.me/masteranandatrades/9271
✅ PREMIUM &Content
—One-Time Payment
t.me/lamatrades/4 (🔝 since 2017)
— Late 2026👇
t.me/masteranandatrades/9279
🔥 10-25X Leverage
—Trade-numbers:
t.me/masteranandatrades/9271
✅ PREMIUM &Content
—One-Time Payment
t.me/lamatrades/4 (🔝 since 2017)
相關出版品
免責聲明
這些資訊和出版物並非旨在提供,也不構成TradingView提供或認可的任何形式的財務、投資、交易或其他類型的建議或推薦。請閱讀使用條款以了解更多資訊。
💯 Trading signals (results)
— Late 2026👇
t.me/masteranandatrades/9279
🔥 10-25X Leverage
—Trade-numbers:
t.me/masteranandatrades/9271
✅ PREMIUM &Content
—One-Time Payment
t.me/lamatrades/4 (🔝 since 2017)
— Late 2026👇
t.me/masteranandatrades/9279
🔥 10-25X Leverage
—Trade-numbers:
t.me/masteranandatrades/9271
✅ PREMIUM &Content
—One-Time Payment
t.me/lamatrades/4 (🔝 since 2017)
相關出版品
免責聲明
這些資訊和出版物並非旨在提供,也不構成TradingView提供或認可的任何形式的財務、投資、交易或其他類型的建議或推薦。請閱讀使用條款以了解更多資訊。