
Hello, community members welcome you all to this market cap BTC.D 1D chart analysis.
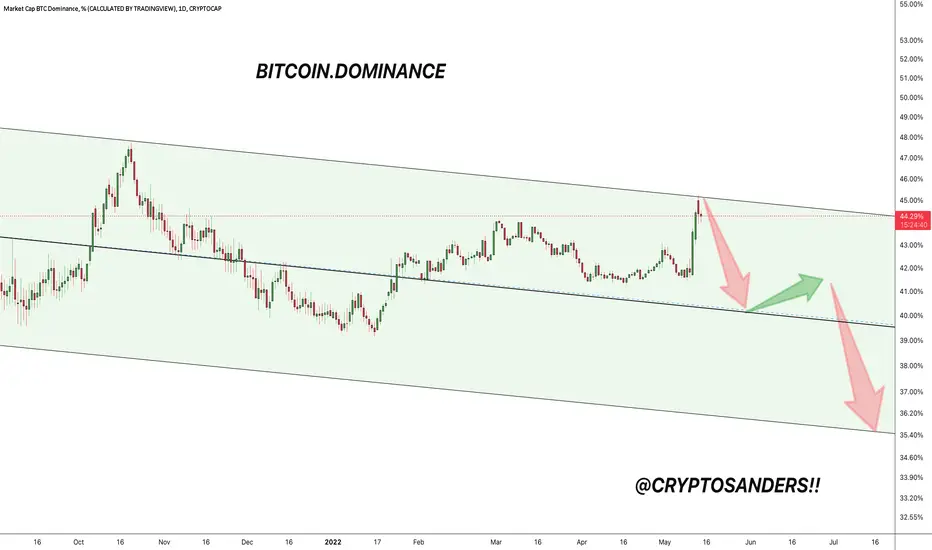
As we can see from the above-mentioned chart that BTC.D war trading inside the parallel Chanel pattern.
Currently, BTC.D faces the upper trend line which is also a resistance level that BTC.D following for the last 355days.
Now here I am expecting a rejection from the resistance level and it will dump towards the middle trend line.
Which will be the green signal for BTC in the upcoming days
This is not a piece of financial advice.
Sorry for my English it is not my native language.
If you like it, hit the like button and share your charts in the comments section.
thank you..
As we can see from the above-mentioned chart that BTC.D war trading inside the parallel Chanel pattern.
Currently, BTC.D faces the upper trend line which is also a resistance level that BTC.D following for the last 355days.
Now here I am expecting a rejection from the resistance level and it will dump towards the middle trend line.
Which will be the green signal for BTC in the upcoming days
This is not a piece of financial advice.
Sorry for my English it is not my native language.
If you like it, hit the like button and share your charts in the comments section.
thank you..

相關出版品
免責聲明
這些資訊和出版物並非旨在提供,也不構成TradingView提供或認可的任何形式的財務、投資、交易或其他類型的建議或推薦。請閱讀使用條款以了解更多資訊。