
hey guys,
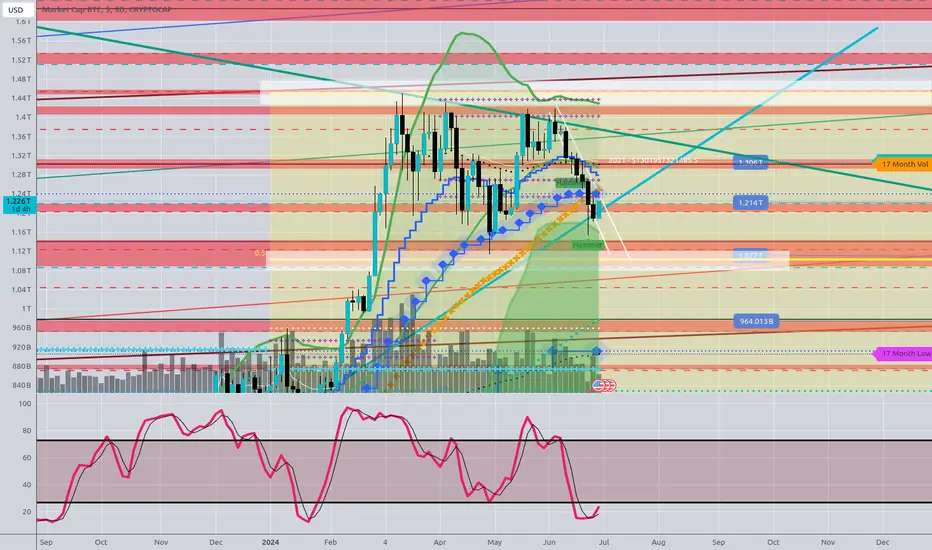
the yearly chart is bullish - main target was the recent ATH at 1.3T.
Quarterly Chart: After the break of the 1.3T Line theres a close below it
-> leaving a bit of doubt about imminent bullish progression or a potential double top forming here. The Inside bar is giving a warning of a possible reversal.
Monthly Chart: Although the demand Line is still intact there is a little divergence on the stochastic
-> there is weakness of 3 months not being able to penetrate highs - but going into a Consolidation.
-> BTC is testing a bullish trendline which, ones it has been broken by a close of the monthly candle, could provide a bearish setup and a possible double top scenario being in place.
I will wait for a break of the Consolidation to think about entering a trade.
Thanks for reading…
the yearly chart is bullish - main target was the recent ATH at 1.3T.
Quarterly Chart: After the break of the 1.3T Line theres a close below it
-> leaving a bit of doubt about imminent bullish progression or a potential double top forming here. The Inside bar is giving a warning of a possible reversal.
Monthly Chart: Although the demand Line is still intact there is a little divergence on the stochastic
-> there is weakness of 3 months not being able to penetrate highs - but going into a Consolidation.
-> BTC is testing a bullish trendline which, ones it has been broken by a close of the monthly candle, could provide a bearish setup and a possible double top scenario being in place.
I will wait for a break of the Consolidation to think about entering a trade.
Thanks for reading…
註釋
good place to close bullish trades as I expect a retest of 1.2T
相關出版品
免責聲明
這些資訊和出版物並非旨在提供,也不構成TradingView提供或認可的任何形式的財務、投資、交易或其他類型的建議或推薦。請閱讀使用條款以了解更多資訊。