
Bitcoin dominance long-term bearish structure continues active
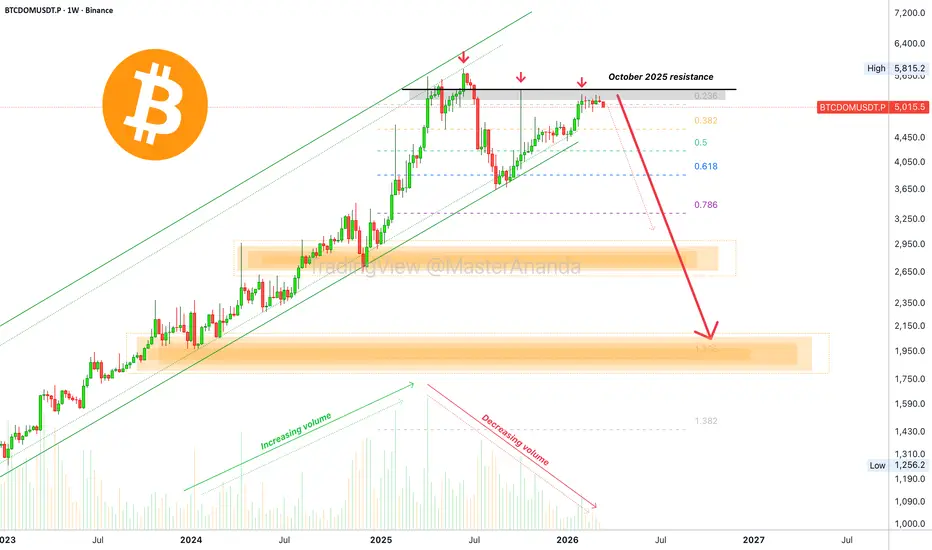
There are two developments, two updates to report on the Bitcoin Dominance index chart—BTCDOMUSDT.
A resumption of the previous uptrend is present. A confirmation of the October 2025 high as resistance is also present.
The continuation of the uptrend changes nothing when it comes to the bigger picture and the next move. Since BTCDOMUSDT failed to move above the October 2025 high, the chart is still bearish, a new lower high is in place.
The October peak happened at 5380, highlighted here with a black line. This is already a lower high compared to June 2025 (5815).
The final lower high came in 2-February 2026 at 5275. Here BTCDOMUSDT went sideways for five weeks and now we are seeing a bearish resumption.
The same signals as before are still present: Decreasing volume and both the MACD and RSI trending lower after a major high.
A crash on the Bitcoin Dominance index supports a major rally on the altcoins market. While Bitcoin Dominance index move down, Bitcoin will also grow.
Further confirmation for a bullish Crypto—marketwide growth is expected as shown by this chart.
You can short this index easily, with low risk with up to 5X.
Namaste.
A resumption of the previous uptrend is present. A confirmation of the October 2025 high as resistance is also present.
The continuation of the uptrend changes nothing when it comes to the bigger picture and the next move. Since BTCDOMUSDT failed to move above the October 2025 high, the chart is still bearish, a new lower high is in place.
The October peak happened at 5380, highlighted here with a black line. This is already a lower high compared to June 2025 (5815).
The final lower high came in 2-February 2026 at 5275. Here BTCDOMUSDT went sideways for five weeks and now we are seeing a bearish resumption.
The same signals as before are still present: Decreasing volume and both the MACD and RSI trending lower after a major high.
A crash on the Bitcoin Dominance index supports a major rally on the altcoins market. While Bitcoin Dominance index move down, Bitcoin will also grow.
Further confirmation for a bullish Crypto—marketwide growth is expected as shown by this chart.
You can short this index easily, with low risk with up to 5X.
Namaste.

Trading Cryptocurrencies can be the hardest undertaking ever without the right trade-numbers, without accurate private-access information. Free is free, but the best always requires sweat, an investment. Since 2017 👇
t.me/masteranandatrades/8778
t.me/masteranandatrades/8778
相關出版品
免責聲明
這些資訊和出版物並非旨在提供,也不構成TradingView提供或認可的任何形式的財務、投資、交易或其他類型的建議或推薦。請閱讀使用條款以了解更多資訊。
Trading Cryptocurrencies can be the hardest undertaking ever without the right trade-numbers, without accurate private-access information. Free is free, but the best always requires sweat, an investment. Since 2017 👇
t.me/masteranandatrades/8778
t.me/masteranandatrades/8778
相關出版品
免責聲明
這些資訊和出版物並非旨在提供,也不構成TradingView提供或認可的任何形式的財務、投資、交易或其他類型的建議或推薦。請閱讀使用條款以了解更多資訊。