
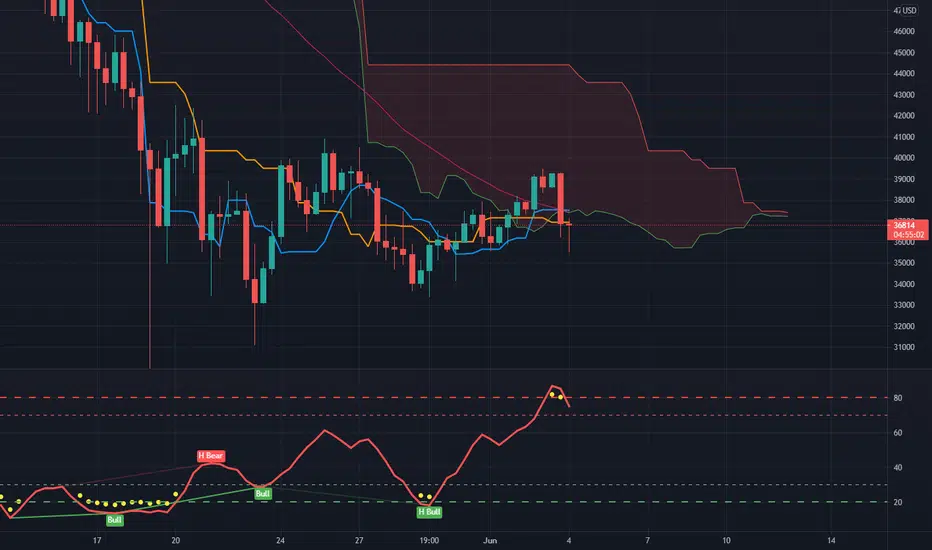
The 10 hour chart on Bitcoin looks super bearish in my opinion. Price is below the cloud. The 50 SMA is pointing down and bitcoin hasn't been able to get back above the 50 SMA on hardly any of the hourly time frames.
註釋
Kijun and Cloud angling down on the 35min chart 註釋
Broke out of the triangle. Currently retesting resistance before we drop 註釋
50 SMA on the 5 hour chart 
免責聲明
這些資訊和出版物並非旨在提供,也不構成TradingView提供或認可的任何形式的財務、投資、交易或其他類型的建議或推薦。請閱讀使用條款以了解更多資訊。
免責聲明
這些資訊和出版物並非旨在提供,也不構成TradingView提供或認可的任何形式的財務、投資、交易或其他類型的建議或推薦。請閱讀使用條款以了解更多資訊。