
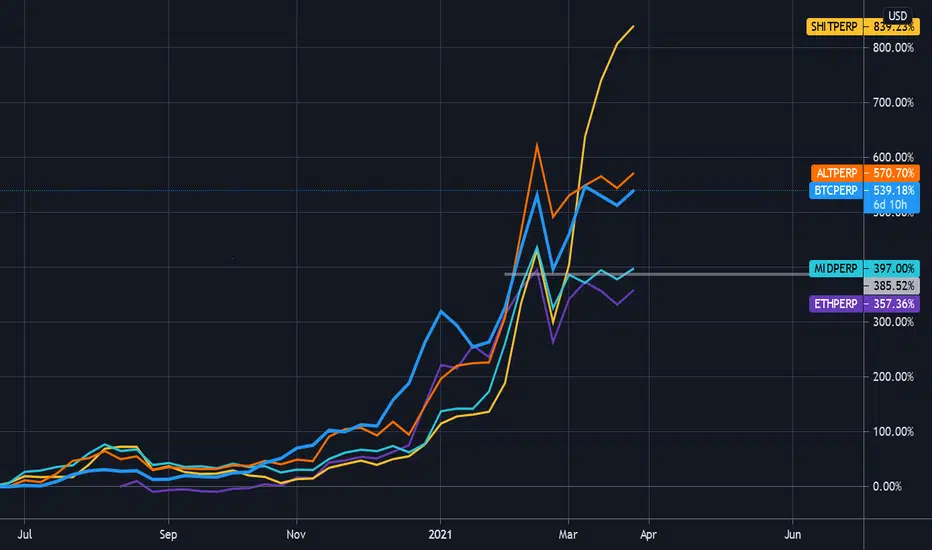
The idea behind this chart is to give a snapshot of the market breadth for the entire crypto market at a glance. It uses the perpetual index futures on the FTX exchange to compare Bitcoin to Ethereum, the ALT index, the Midcap index,and the SHIT index.
This particular chart is using a Weekly interval and uses the March 2020 lows as it's anchor point (adjust scale if necessary). It's clear to see that while Bitcoin has been grabbing most of the headlines, the SHITCOIN index is in the driver's seat (help.ftx.com/hc/en-us/articles/360027668812-Index-Calculation).
This particular chart is using a Weekly interval and uses the March 2020 lows as it's anchor point (adjust scale if necessary). It's clear to see that while Bitcoin has been grabbing most of the headlines, the SHITCOIN index is in the driver's seat (help.ftx.com/hc/en-us/articles/360027668812-Index-Calculation).

免責聲明
這些資訊和出版物並非旨在提供,也不構成TradingView提供或認可的任何形式的財務、投資、交易或其他類型的建議或推薦。請閱讀使用條款以了解更多資訊。
免責聲明
這些資訊和出版物並非旨在提供,也不構成TradingView提供或認可的任何形式的財務、投資、交易或其他類型的建議或推薦。請閱讀使用條款以了解更多資訊。