
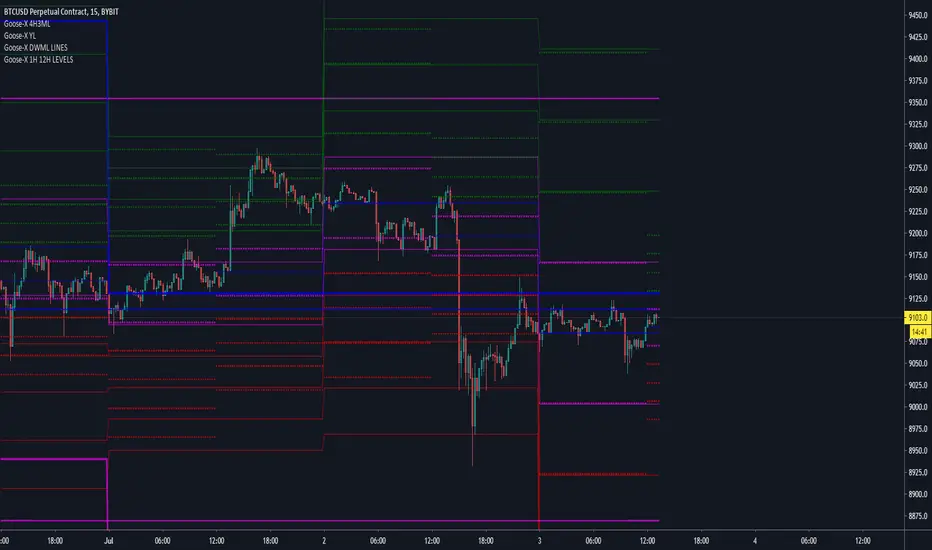
Chart containing all GX levels ( support/resistance ) of various periods: 1hr, 4hr, 12hr, 1day, 1week, 1month, 3months, 1year.
These are the most important and pre-fixed support/resist zones already written at every 00:00 UTC of the used period.
For example yearly levels are written there since 1° Jan 2020 00:00 UTC
These are the most important and pre-fixed support/resist zones already written at every 00:00 UTC of the used period.
For example yearly levels are written there since 1° Jan 2020 00:00 UTC

免責聲明
這些資訊和出版物並非旨在提供,也不構成TradingView提供或認可的任何形式的財務、投資、交易或其他類型的建議或推薦。請閱讀使用條款以了解更多資訊。