
Hello
It's a Bitcoin Guide.
My analysis is optimized for TradingView.
If you press the Replay button, you can check real-time movements.

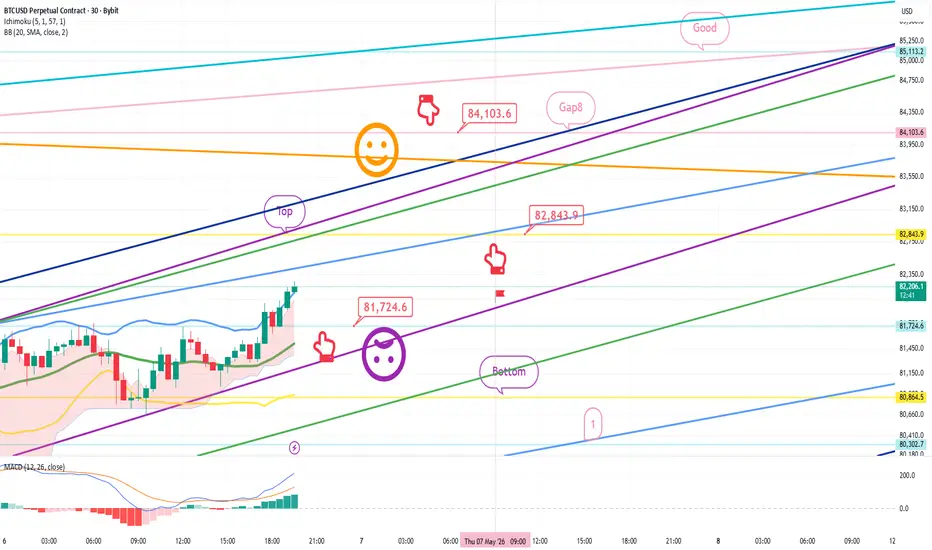
This is the Bitcoin 30-minute chart.
The Nasdaq is also continuing to rise.
*Long Position Strategy based on the movement path of the red finger
1) $81,724.6 is the entry point for a long position / Stop loss if the purple support line is broken
2) $84,103.6 is the 1st target for a long position -> Good 2nd target
If the strategy is successful, the Top zone serves as a re-entry zone for the long position.
If the purple support line is broken,
it could fall to the Bottom -> up to Zone 1, so please exercise caution.
Please use my analysis post merely as a reference and for practical application.
I hope you operate safely by strictly adhering to trading principles and using stop loss measures as a necessity.
Thank you.
It's a Bitcoin Guide.
My analysis is optimized for TradingView.
If you press the Replay button, you can check real-time movements.
This is the Bitcoin 30-minute chart.
The Nasdaq is also continuing to rise.
*Long Position Strategy based on the movement path of the red finger
1) $81,724.6 is the entry point for a long position / Stop loss if the purple support line is broken
2) $84,103.6 is the 1st target for a long position -> Good 2nd target
If the strategy is successful, the Top zone serves as a re-entry zone for the long position.
If the purple support line is broken,
it could fall to the Bottom -> up to Zone 1, so please exercise caution.
Please use my analysis post merely as a reference and for practical application.
I hope you operate safely by strictly adhering to trading principles and using stop loss measures as a necessity.
Thank you.
手動結束交易
Hello.This is the Bitcoin Guide.
Let's check the movements since the analysis post was written on May 6th.
This is the Bitcoin 30-minute chart.
I have marked the key zones with a black finger.
In the red finger long position strategy,
after entering a long position at $81,724.6,
the market ended an extreme sideways trend by breaking the purple support line.
Since the candle formed to the right near the entry point without any major waves,
it reached the purple -> green support line, and
the strategy was manually liquidated.
A new daily candle formed today,
touched the bottom zone, and is continuing to move sideways.
Recently, I have been deliberately operating safely without taking risks, but starting today, I will proceed with greater focus.
For those currently operating long or short positions,
please refer to Zone 1 at the bottom, and I will continue with the analysis immediately.
Thank you.

[Bitcoin Guide Affiliate]
*Bybit 20%DC Lifetime + $30,100
partner.bybit.com/b/Bitcoin_Guide
*BingX 50%DC + $14,100
bit.ly/3E8ZkAW
*ZeroMarket ECN 40%DC
bit.ly/3pY0dUv
*Telegram
t.me/bitcoinguide_TM
*Bybit 20%DC Lifetime + $30,100
partner.bybit.com/b/Bitcoin_Guide
*BingX 50%DC + $14,100
bit.ly/3E8ZkAW
*ZeroMarket ECN 40%DC
bit.ly/3pY0dUv
*Telegram
t.me/bitcoinguide_TM
相關出版品
免責聲明
這些資訊和出版物並非旨在提供,也不構成TradingView提供或認可的任何形式的財務、投資、交易或其他類型的建議或推薦。請閱讀使用條款以了解更多資訊。
[Bitcoin Guide Affiliate]
*Bybit 20%DC Lifetime + $30,100
partner.bybit.com/b/Bitcoin_Guide
*BingX 50%DC + $14,100
bit.ly/3E8ZkAW
*ZeroMarket ECN 40%DC
bit.ly/3pY0dUv
*Telegram
t.me/bitcoinguide_TM
*Bybit 20%DC Lifetime + $30,100
partner.bybit.com/b/Bitcoin_Guide
*BingX 50%DC + $14,100
bit.ly/3E8ZkAW
*ZeroMarket ECN 40%DC
bit.ly/3pY0dUv
*Telegram
t.me/bitcoinguide_TM
相關出版品
免責聲明
這些資訊和出版物並非旨在提供,也不構成TradingView提供或認可的任何形式的財務、投資、交易或其他類型的建議或推薦。請閱讀使用條款以了解更多資訊。