
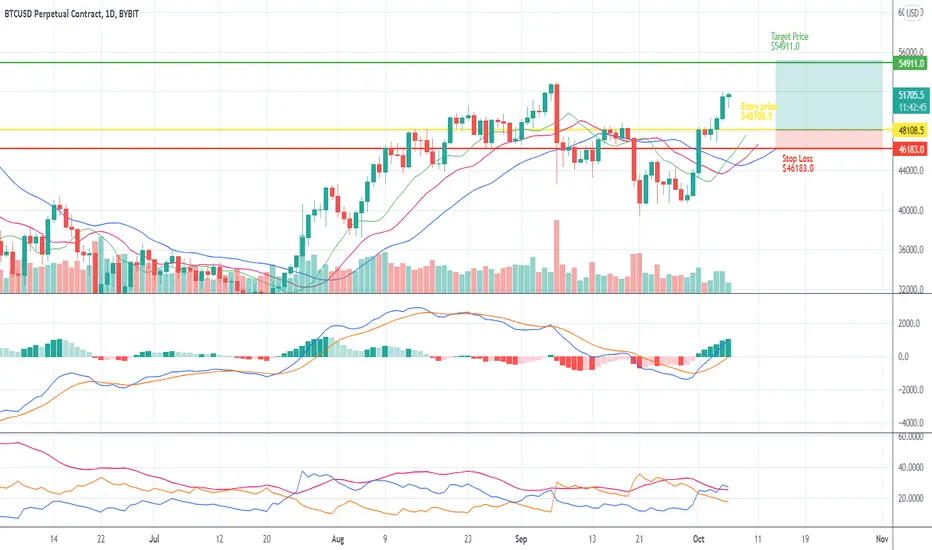
The indicators used to analyse this chart suggests a bullish movement. Indeed, as we can see, we have more than one buy signal on this market.
MACD line has just crossed above the signal line, indicating the presence of a bullish momentum.
DMI indicator shows us the same signal as MACD. Indeed, the blue line (+DM) has crossed above the orange one (-DM). Furthermore ADX , the pink line is above 25 and this indicate us that the price movement is strong.
About Williams Alligator, the lines (teeth and lips) have just crossed above jaw line and this is a clear buy signal.
In conclusion, all the instruments used on the chart indicate us to open a long position. But before opening this position we have to wait for confirmation. Price has just broken out the resistance so we should wait for the price to retest it as a support.
No financial advice
MACD line has just crossed above the signal line, indicating the presence of a bullish momentum.
DMI indicator shows us the same signal as MACD. Indeed, the blue line (+DM) has crossed above the orange one (-DM). Furthermore ADX , the pink line is above 25 and this indicate us that the price movement is strong.
About Williams Alligator, the lines (teeth and lips) have just crossed above jaw line and this is a clear buy signal.
In conclusion, all the instruments used on the chart indicate us to open a long position. But before opening this position we have to wait for confirmation. Price has just broken out the resistance so we should wait for the price to retest it as a support.
No financial advice

💥 Free signals and ideas ➡ t.me/vfinvestment
免責聲明
這些資訊和出版物並非旨在提供,也不構成TradingView提供或認可的任何形式的財務、投資、交易或其他類型的建議或推薦。請閱讀使用條款以了解更多資訊。
💥 Free signals and ideas ➡ t.me/vfinvestment
免責聲明
這些資訊和出版物並非旨在提供,也不構成TradingView提供或認可的任何形式的財務、投資、交易或其他類型的建議或推薦。請閱讀使用條款以了解更多資訊。