
#BTC
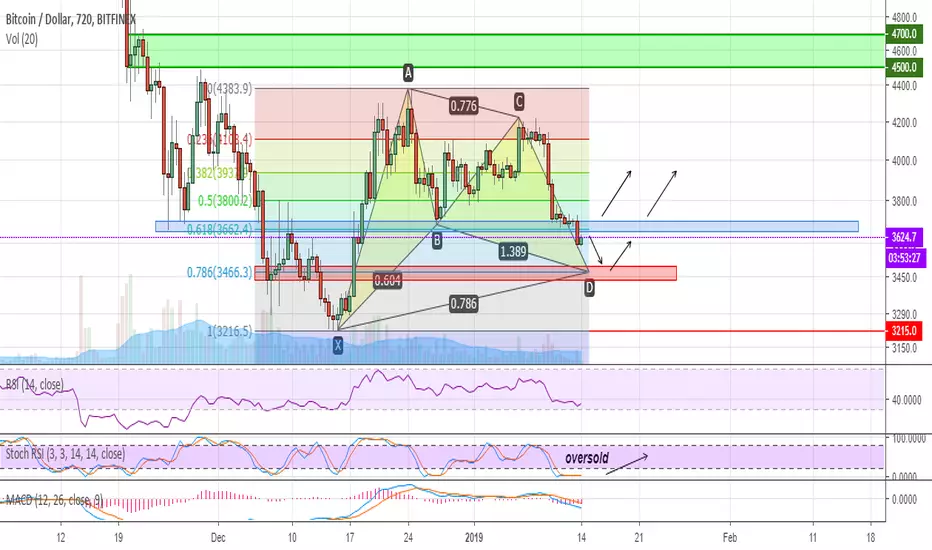
On the 12-hour scale, the market has been oversold for several days already; the Stoch RSI can bounce and move up. The formation of the XABCD pattern is also seen, which may lead the price to the area 3466 corresponding to the level of Fib 0.786, which, as a rule, is often reversal and then we should expect a rebound.
Globally, the market is now very neutral: for positive, we need to rise above Fib 0.618 (about 3662, the blue area on the chart), while we are lower there is a chance to touch Fib 0.786 (about 3466, the red area on the chart) and if this support will withstand market pressure, then we will observe a noticeable rebound, if we fix under it, then we should expect a move to the area below. As long as there are no reasons for a global decline, perhaps the market will be able to form a double bottom and we will get a stronger and more significant rebound.
Not a call to action. Vision on now, we are still out of position, we have placed orders, we are waiting for entry
交易進行
#BTCRising above Fib 0.618 (blue area on the chart) is a good sign.

免責聲明
這些資訊和出版物並非旨在提供,也不構成TradingView提供或認可的任何形式的財務、投資、交易或其他類型的建議或推薦。請閱讀使用條款以了解更多資訊。
免責聲明
這些資訊和出版物並非旨在提供,也不構成TradingView提供或認可的任何形式的財務、投資、交易或其他類型的建議或推薦。請閱讀使用條款以了解更多資訊。