
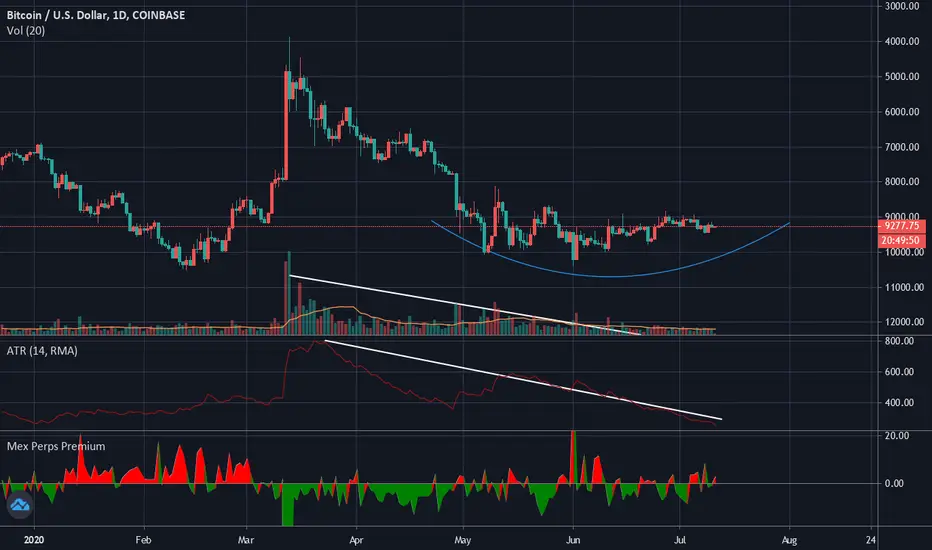
I've always found it hard to understand the chart for the bears as I am naturally bullish.. The inverted chart can give us a better feel of how the bears are doing. As you can see the bears have formed an arc of resistance and a big move is coming. Volatility and volume is decreasing. 9800 area is a significant area and perfect coincides with fibonnaci resistance. If the bulls are able to break through 9800 then we can expect a market rally, but with the fundamentals of the economy being weak because of corona virus be careful longing!
That is all for this analysis. If you guys think this analysis is correct please hit the thumbs up button and follow me for more analysis in the future!
That is all for this analysis. If you guys think this analysis is correct please hit the thumbs up button and follow me for more analysis in the future!
交易進行
Latest daily trading journal entry Check out my portfolio. : youtube.com/watch?v=9tZSK_1MSCE
交易進行
Dropped $100. But still waiting for that massive rug pull. Check out my TA and my portfolio's performance thus far here:
youtu.be/KhoJlAK1XUs

免責聲明
這些資訊和出版物並非旨在提供,也不構成TradingView提供或認可的任何形式的財務、投資、交易或其他類型的建議或推薦。請閱讀使用條款以了解更多資訊。
免責聲明
這些資訊和出版物並非旨在提供,也不構成TradingView提供或認可的任何形式的財務、投資、交易或其他類型的建議或推薦。請閱讀使用條款以了解更多資訊。