
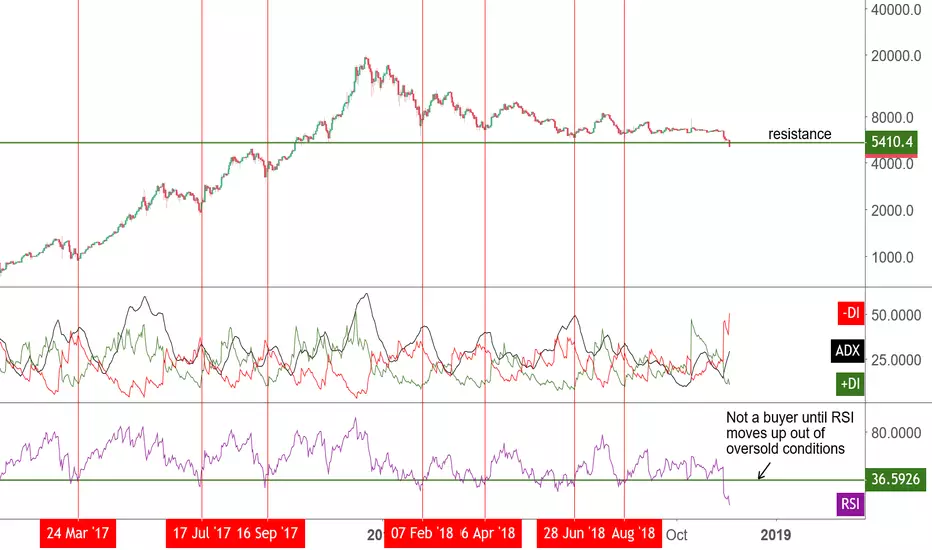
Each red vertical line is signaling when the RSI moved up out of oversold conditions. The price rallied nicely each time. This indicator can stay well under the green line to keep the market oversold.
So, I will be looking for a buy when the RSI gets back above the green horizontal line and moves out of oversold conditions (or forms a divergence to price when down here). A move out of oversold conditions will likely happen on a clear upside break of marked resistance on the chart. And I would want internal trend momentum to back the upside move. I will use the ADX indicator to help guide that decision since it measure trend strength.
I will not buy the bottom, but I will be buying when a nice bull trend is establishing and will make up for it in the long run.
Thoughts?
So, I will be looking for a buy when the RSI gets back above the green horizontal line and moves out of oversold conditions (or forms a divergence to price when down here). A move out of oversold conditions will likely happen on a clear upside break of marked resistance on the chart. And I would want internal trend momentum to back the upside move. I will use the ADX indicator to help guide that decision since it measure trend strength.
I will not buy the bottom, but I will be buying when a nice bull trend is establishing and will make up for it in the long run.
Thoughts?

免責聲明
這些資訊和出版物並非旨在提供,也不構成TradingView提供或認可的任何形式的財務、投資、交易或其他類型的建議或推薦。請閱讀使用條款以了解更多資訊。
免責聲明
這些資訊和出版物並非旨在提供,也不構成TradingView提供或認可的任何形式的財務、投資、交易或其他類型的建議或推薦。請閱讀使用條款以了解更多資訊。