
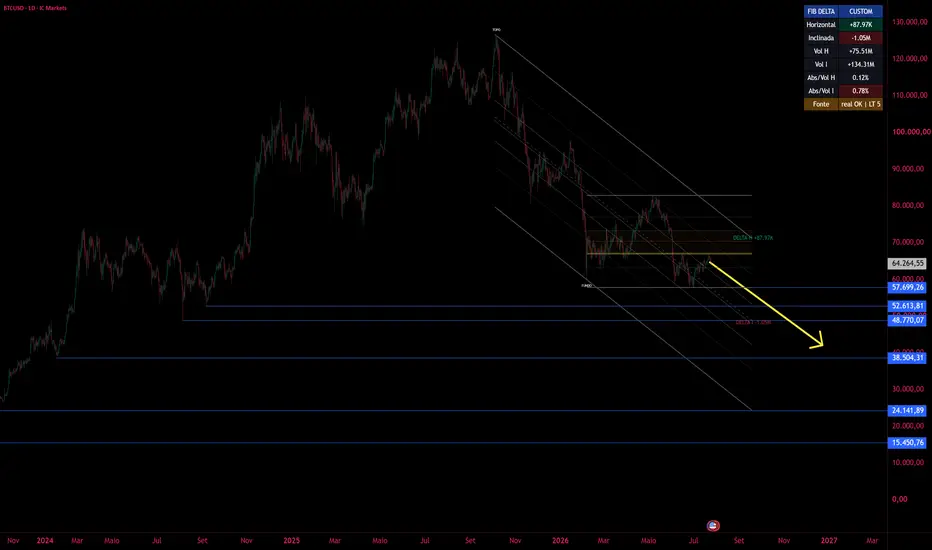
BTCUSD remains inside a descending channel on the daily chart.
The latest upside move reached a Fibonacci confluence area aligned with the Point of Control (POC) and was rejected. This keeps the bearish structure in focus while price trades below channel resistance.
The chart maps a sequence of support zones rather than fixed price targets. The key level is around 57.7k. If that area fails to hold, attention shifts to the next support regions below, including 55k, 52.6k and 48.8k.
This study uses the Fib Delta Custom indicator to combine horizontal and diagonal delta readings with volume context, helping identify areas of confluence and potential reaction zones.
At this stage, the main focus is how price reacts around the 57.7k support area. A confirmed breakdown would keep the broader bearish structure in play and bring the lower mapped zones into focus.
The latest upside move reached a Fibonacci confluence area aligned with the Point of Control (POC) and was rejected. This keeps the bearish structure in focus while price trades below channel resistance.
The chart maps a sequence of support zones rather than fixed price targets. The key level is around 57.7k. If that area fails to hold, attention shifts to the next support regions below, including 55k, 52.6k and 48.8k.
This study uses the Fib Delta Custom indicator to combine horizontal and diagonal delta readings with volume context, helping identify areas of confluence and potential reaction zones.
At this stage, the main focus is how price reacts around the 57.7k support area. A confirmed breakdown would keep the broader bearish structure in play and bring the lower mapped zones into focus.

免責聲明
這些資訊和出版物並非旨在提供,也不構成TradingView提供或認可的任何形式的財務、投資、交易或其他類型的建議或推薦。請閱讀使用條款以了解更多資訊。