
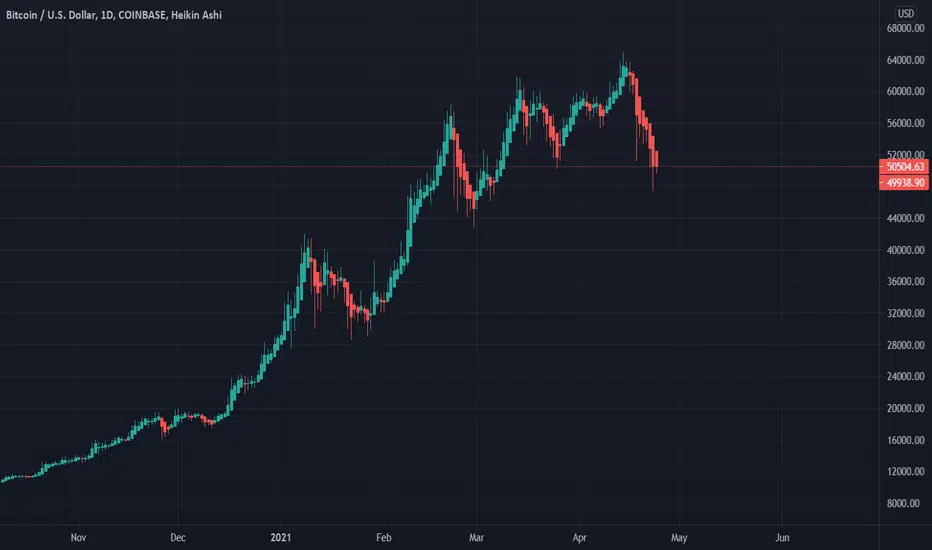
You are going to start with a white screen most likely; my number-one recommendation is to change it to a dark background to save your eyes... Right click on the graph, and scroll down until you find color scheme or something like that and choose dark. Once you get use to your own graph I would recommend right clicking on the graph and play with the settings to find what works best for you. The next published chart will show you how to add indicators. I will be showing you indicators that have been tried and true to me, but feel free to try anything your heart desires so that you can create what you like and to be your own artist. P.S., CHEERS!

免責聲明
這些資訊和出版物並非旨在提供,也不構成TradingView提供或認可的任何形式的財務、投資、交易或其他類型的建議或推薦。請閱讀使用條款以了解更多資訊。
免責聲明
這些資訊和出版物並非旨在提供,也不構成TradingView提供或認可的任何形式的財務、投資、交易或其他類型的建議或推薦。請閱讀使用條款以了解更多資訊。