
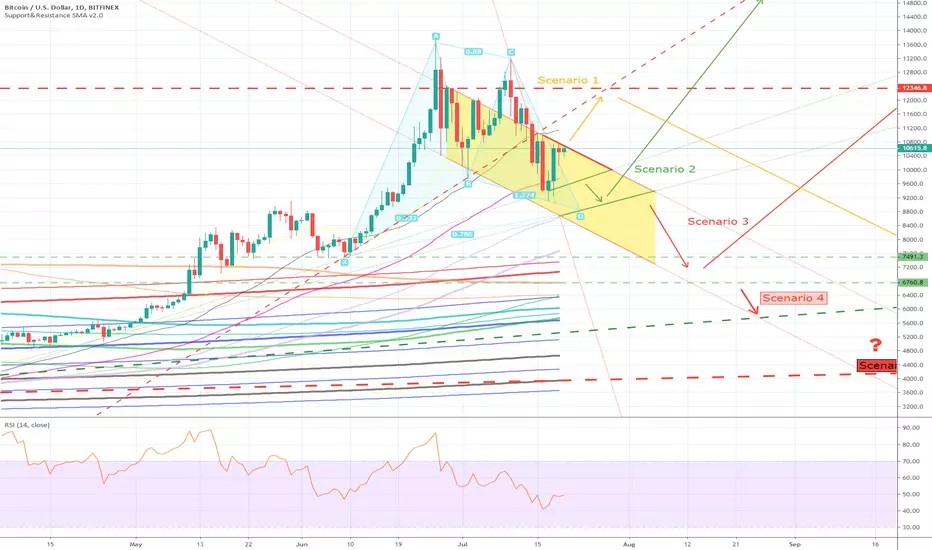
Before any of you jump up and scream, "That's not how you identify a pattern!!", namely the Bullish Gartley (***which may or may not be in formation***) is just an imaginary depiction to support the case of Scenario 2.
Scenario 1 - Bull Trap
Scenario 2 - Continued Bullish Momentum
Scenario 3 - Bear Trap
Scenario 4 - Long Due Correction
Scenario 5 - RIP?
I don't see the need for more words here. Questions are welcome!
Scenario 1 - Bull Trap
Scenario 2 - Continued Bullish Momentum
Scenario 3 - Bear Trap
Scenario 4 - Long Due Correction
Scenario 5 - RIP?
I don't see the need for more words here. Questions are welcome!
註釋
FYI, the arrows try best to point out the possible price range and timeline註釋
It would be nice if the visitors leave in the comment section below, which scenario you think is more likely.As always, please leave a like, if you think my idea is like worthy! Peace!
註釋
註釋
I'm more convinced than ever, that this has a very high probability of playing out.交易進行
I would say,Short Entry: 10660 with SL: 10820
Target: 8500
***Trade at your own risk, I'm not accepting liabilities***
取消訂單
On second thoughts, that was cocky! It's always better to be safe than sorry. I will update with targets again, when things actually start playing out.註釋
Breaking out upwards!! Be cautious, better to buy a pull back!!註釋
If its not a trap and actually plays out, first target @ 11429註釋
Second Target @ 11690註釋
While the target for the symmetric triangle lies at 12333, doesn't mean BTC has to reach for it.交易進行
手動結束交易
Close as you see fit註釋
<deleted>註釋

註釋
Updates: 
註釋
Looks like scenario 2 is in play, over the days and weeks its quite hard to recollect even if you make notes, why you ended up making such a decision!! :(
免責聲明
這些資訊和出版物並非旨在提供,也不構成TradingView提供或認可的任何形式的財務、投資、交易或其他類型的建議或推薦。請閱讀使用條款以了解更多資訊。
免責聲明
這些資訊和出版物並非旨在提供,也不構成TradingView提供或認可的任何形式的財務、投資、交易或其他類型的建議或推薦。請閱讀使用條款以了解更多資訊。