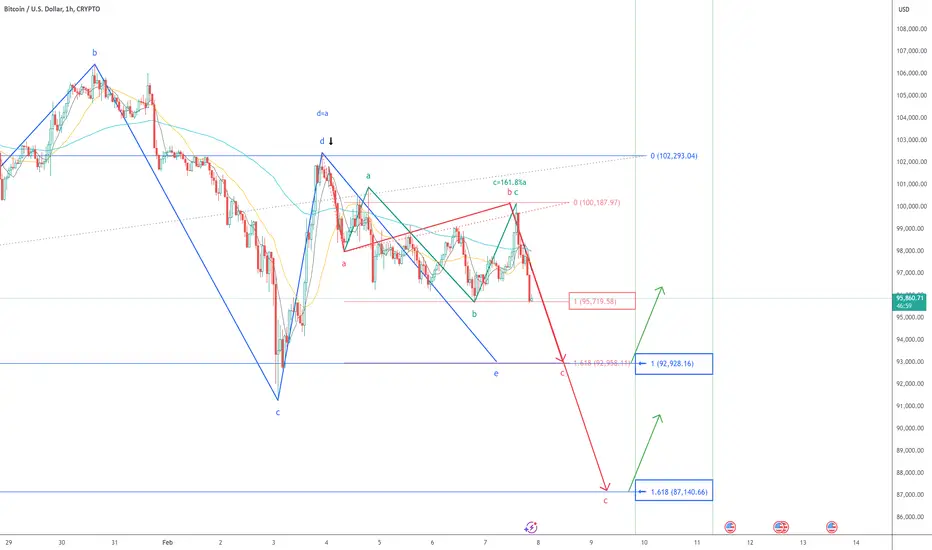
The chart illustrates potential targets for the current correction pattern of $BTC. If the $957xx level is broken, the decline is likely to continue to T1 ($92,928) or even further to T2 ($87,140)
Let's see how it goes!
#BTC #BTCUSD #Bitcoin BTC
BTC
Let's see how it goes!
#BTC #BTCUSD #Bitcoin
BTC
免責聲明
這些資訊和出版物並非旨在提供,也不構成TradingView提供或認可的任何形式的財務、投資、交易或其他類型的建議或推薦。請閱讀使用條款以了解更多資訊。