
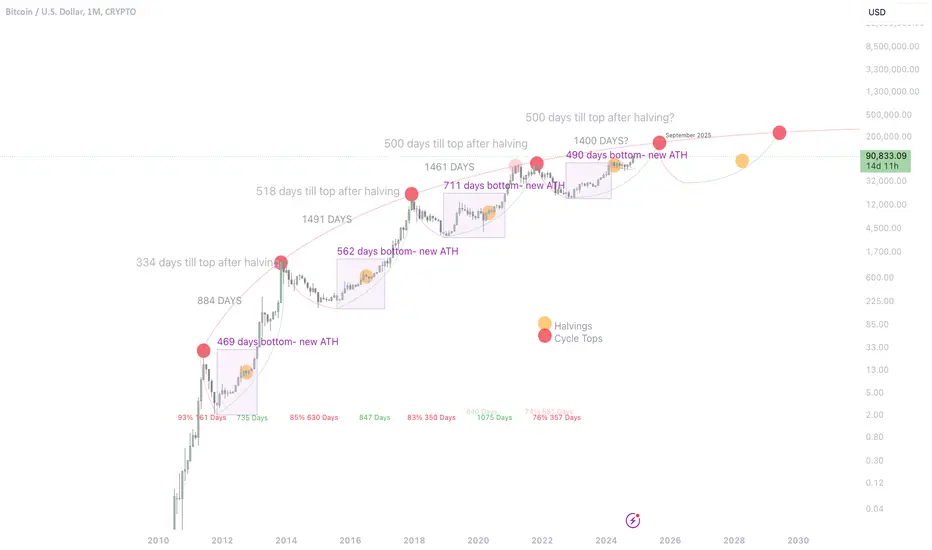
This chart highlights the remarkable consistency in Bitcoin's historical cycles, showcasing how price movements align across different cycles in terms of duration (days) and percentage changes. By visualizing these repeating patterns, you can gain valuable insights into Bitcoin's cyclical behavior and potential future trends.

免責聲明
這些資訊和出版物並非旨在提供,也不構成TradingView提供或認可的任何形式的財務、投資、交易或其他類型的建議或推薦。請閱讀使用條款以了解更多資訊。