
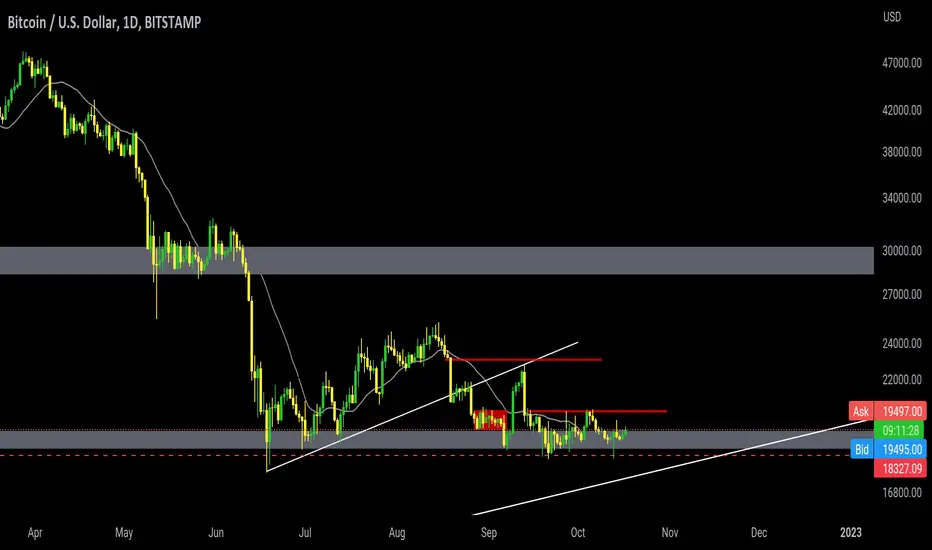
What can be seen in the chart, apart from the discussion of fundamentals, we are at the end of leg 2, and leg 2 overlaps with the break-even level, and these chats that occurred at the end of the trend can most likely be an extension Gap.
In general, this correction can be considered a pullback at the breakeven level (19,000).
But for more believers, it is possible to wait for the breakout trading range that has been specified. or looking for signal bars with good gap
The next reason is to approach the long-term trend line of the chart.

相關出版品
免責聲明
這些資訊和出版物並非旨在提供,也不構成TradingView提供或認可的任何形式的財務、投資、交易或其他類型的建議或推薦。請閱讀使用條款以了解更多資訊。