
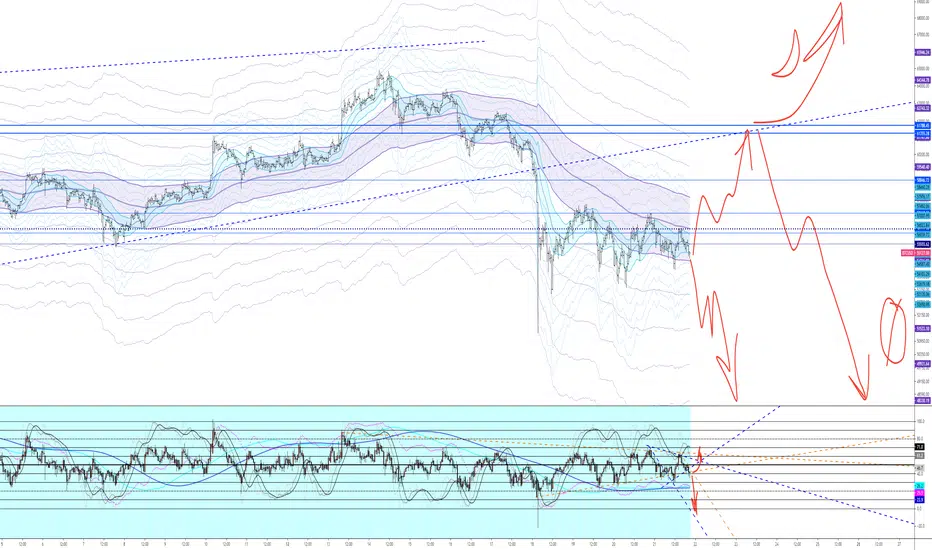
As you can see by the squiggles there are many paths bitcoin can take, here you can see some levels in horizontal solid blue lines, they're pretty aren't they?
I choose these levels because of distance (time) and closes. (emotion)
This is a 40 minute chart. Can you see?
I choose 40 because it's 1/6th of the 4 hour which is 1/6th of a day? Can I maths?
Do you like... THAT?!!
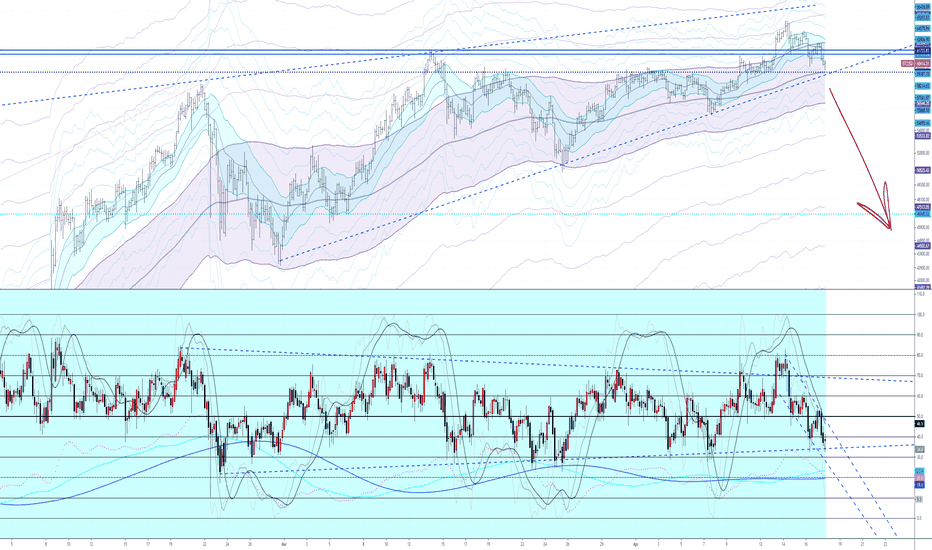
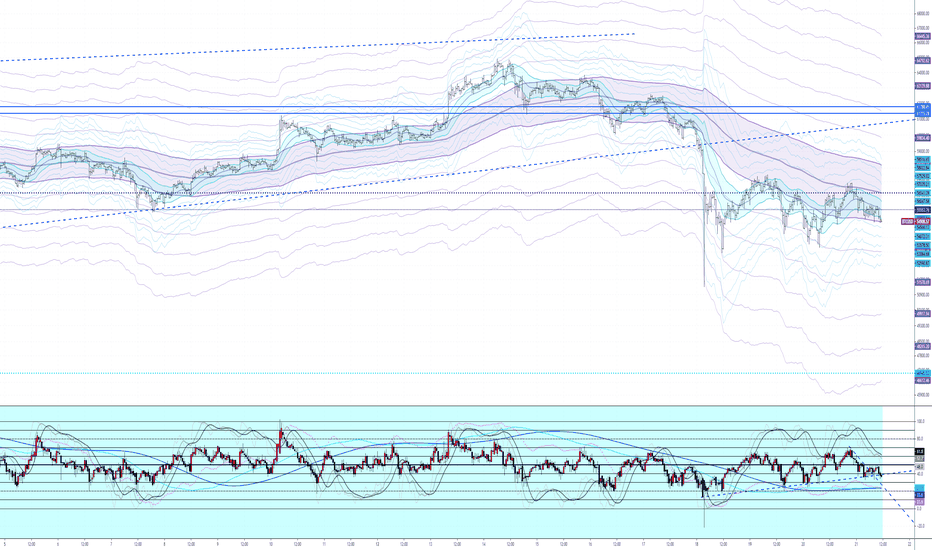
I use the Keltner channel and I also use it to create zones for breakouts or drops.
Oh baby? baby, the reason I breath is you
Boy, you got me blinded
Oh pretty baby, there's nothing that I wouldn't do
It's not the way I planned it
Show me how you want it to be
Tell me, baby, 'cause I need to know now, oh, because...
This is not financial advice.
It's not.
I hope this is descriptive enough for (((them,they,xi,xir,she,her,it,their)))
---
---
---
(((HIDDEN BECAUSE IT WASN'T GOOD ENOUGH)))

註釋
None of my charts will play update
免責聲明
這些資訊和出版物並非旨在提供,也不構成TradingView提供或認可的任何形式的財務、投資、交易或其他類型的建議或推薦。請閱讀使用條款以了解更多資訊。