
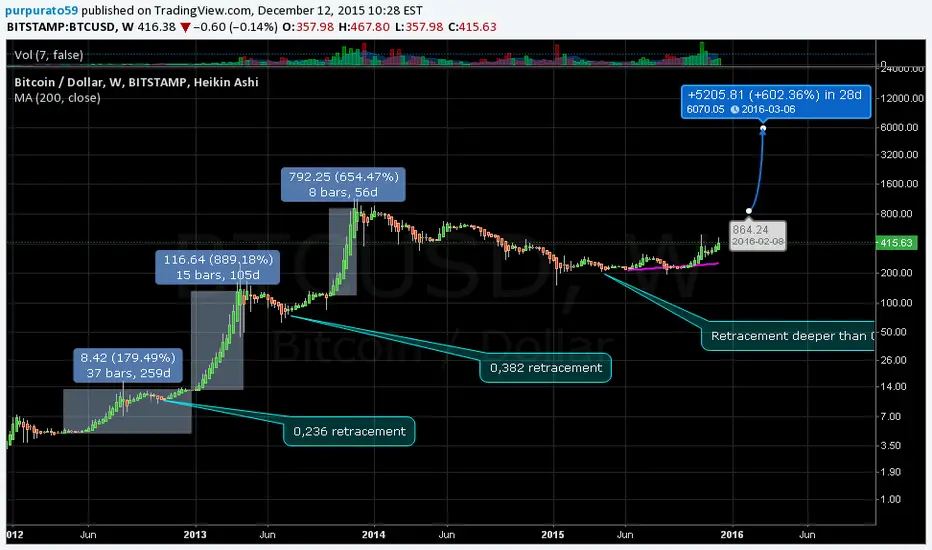
I just traced this using a log scale and Heiken Ashi candles. My purpose was to make an analysis of the great bull runs in bitcoin history. What I see
- Each succesive bullrun has started after the price stabilized on the previous peak.
- Every bullrun has been shorter than the previous one, around half the time.
- Retracements have been deeper everytime
Conclusions on the next bullrun:
- It will come after the price has stabilized around 1000
- It will be shorter than the previous one, something like a month
- It will be the same size in log terms, that is, it will go up to 5000
- It will retrace even harder, that is maybe even full retrace, back to 1000. The price seems to be less stable everytime.
- Each succesive bullrun has started after the price stabilized on the previous peak.
- Every bullrun has been shorter than the previous one, around half the time.
- Retracements have been deeper everytime
Conclusions on the next bullrun:
- It will come after the price has stabilized around 1000
- It will be shorter than the previous one, something like a month
- It will be the same size in log terms, that is, it will go up to 5000
- It will retrace even harder, that is maybe even full retrace, back to 1000. The price seems to be less stable everytime.

免責聲明
這些資訊和出版物並非旨在提供,也不構成TradingView提供或認可的任何形式的財務、投資、交易或其他類型的建議或推薦。請閱讀使用條款以了解更多資訊。
免責聲明
這些資訊和出版物並非旨在提供,也不構成TradingView提供或認可的任何形式的財務、投資、交易或其他類型的建議或推薦。請閱讀使用條款以了解更多資訊。