
Greetings!
This is my long-term analysis of bitcoin based on the logarithmic chart.
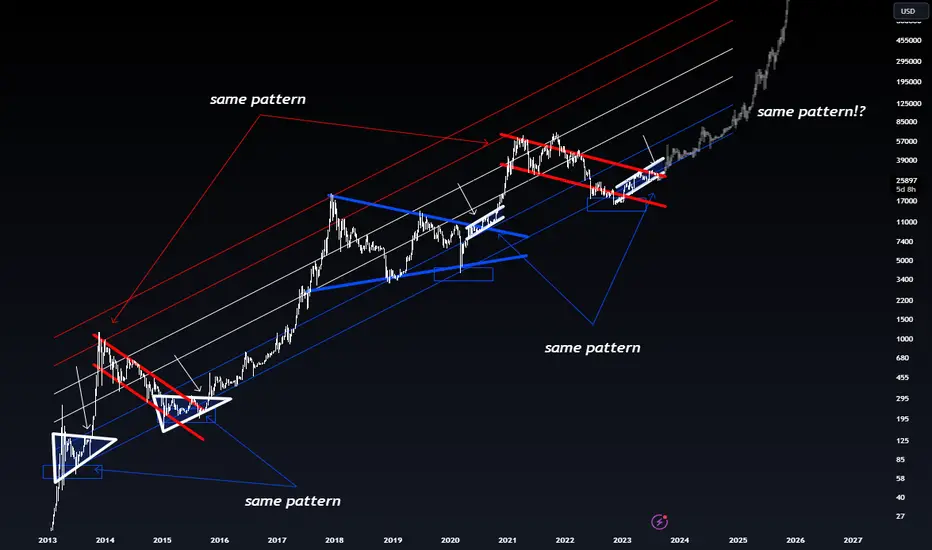
I notice that there are price patterns that are repeating.
1.March 2013- September 2013
1.January 2015-September 2015.
2. November 2013-August 2015.
2. January 2021-August 2023.
3. April 2020-November 2020.
3. January 2023-August 2023.
I bet bitcoin would do the same pattern from September 2015 to December 2017, in the next few months. If so, we could see bitcoin at 1 million dollars by December 2025.
Buy SPOT TRADING and HODL until up December 2025.
I will be updating this idea.
We're early...
JB.-
This is my long-term analysis of bitcoin based on the logarithmic chart.
I notice that there are price patterns that are repeating.
1.March 2013- September 2013
1.January 2015-September 2015.
2. November 2013-August 2015.
2. January 2021-August 2023.
3. April 2020-November 2020.
3. January 2023-August 2023.
I bet bitcoin would do the same pattern from September 2015 to December 2017, in the next few months. If so, we could see bitcoin at 1 million dollars by December 2025.
Buy SPOT TRADING and HODL until up December 2025.
I will be updating this idea.
We're early...
JB.-
註釋
If you have any idea, please post below... thanks!交易進行
...
免責聲明
這些資訊和出版物並非旨在提供,也不構成TradingView提供或認可的任何形式的財務、投資、交易或其他類型的建議或推薦。請閱讀使用條款以了解更多資訊。