
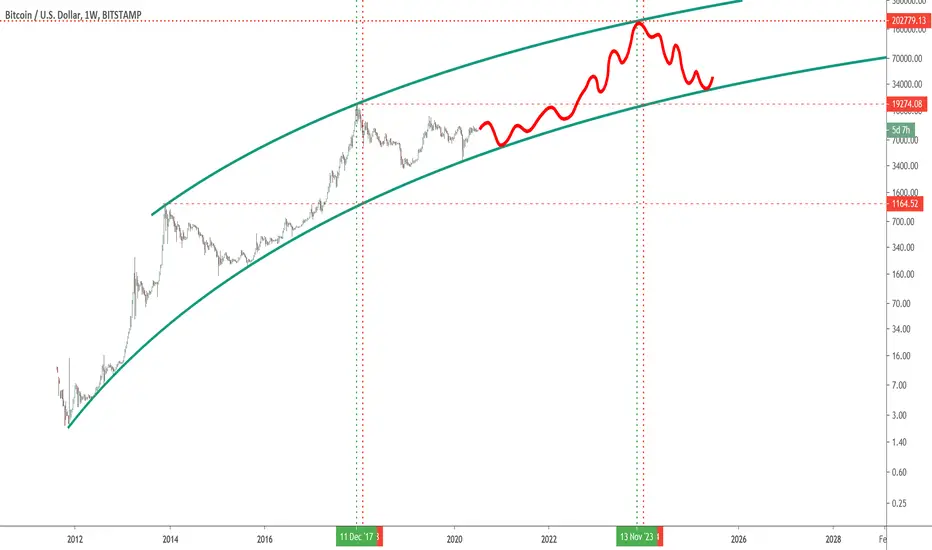
Playing around with the log chart, just trying to get some concept of where the price extremes are and where important lines (like ATH) converge. The last market cycle had bitcoin making its ATH seven weeks before the previous ATH converged with the bottom trend line. If the same thing were to happen this cycle, and the high comes in exactly on the top trend line, then we'd see a high of around $200K on the 13th of November, 2023.
That's still a ways off, but I think I can live with that kind of return in just over three years :)
That's still a ways off, but I think I can live with that kind of return in just over three years :)

免責聲明
這些資訊和出版物並非旨在提供,也不構成TradingView提供或認可的任何形式的財務、投資、交易或其他類型的建議或推薦。請閱讀使用條款以了解更多資訊。
免責聲明
這些資訊和出版物並非旨在提供,也不構成TradingView提供或認可的任何形式的財務、投資、交易或其他類型的建議或推薦。請閱讀使用條款以了解更多資訊。