
I'm a beginner but fascinated by the patterns in charts.
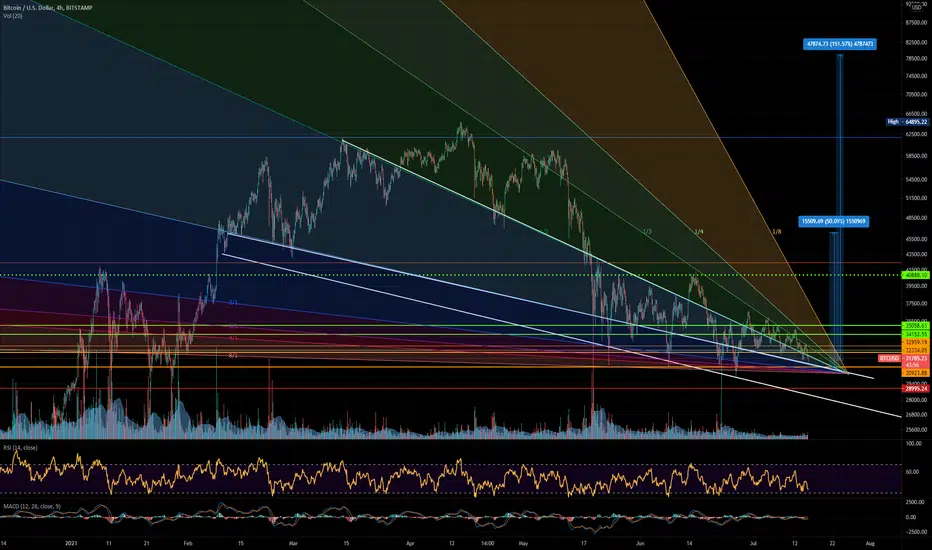
This BTC chart looks like we are drawn to one date and price.
The start of the pattern is half way February, that's coincides with the start of the Wyckoff pattern.
Depending of the start of the triangle/wedge a 50% to 150% gain is possible when the breakout is to the upside.

免責聲明
這些資訊和出版物並非旨在提供,也不構成TradingView提供或認可的任何形式的財務、投資、交易或其他類型的建議或推薦。請閱讀使用條款以了解更多資訊。