
please note: this is not a complete trading idea. This analysis is entirely based off historical data.
Many of us know that Bitcoin has seen several major correction throughout its lifespan. The last major correction took place back in late 2013, which resulted in a 90% correction from the top.
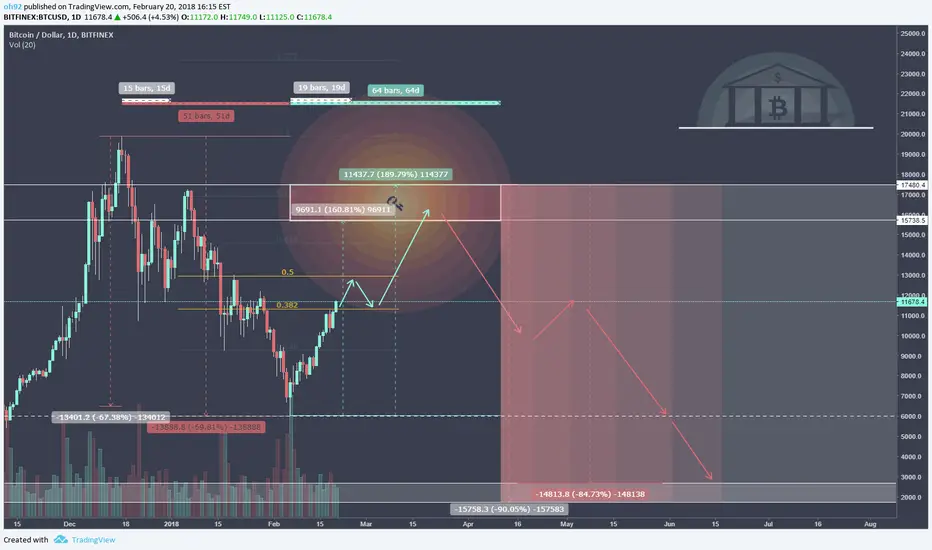
The chart above shows the percentages and ratios I collected from the 2013 crash that were then overlaid onto the recent Bitcoin chart.
Creating the possible route Bitcoin could take IF it follows the 2013 path.
The percentages & time frames that were collected are shown in grey. The red and green colors shows what I expect to happen based on the data.
The chart below shows the percentages collected for this experiment.

DISCLAIMER:
Please note I am only providing my own trading information for your benefit and insight to my trading techniques, you should do your own due diligence and not take this information as a trade signal.
Many of us know that Bitcoin has seen several major correction throughout its lifespan. The last major correction took place back in late 2013, which resulted in a 90% correction from the top.
The chart above shows the percentages and ratios I collected from the 2013 crash that were then overlaid onto the recent Bitcoin chart.
Creating the possible route Bitcoin could take IF it follows the 2013 path.
The percentages & time frames that were collected are shown in grey. The red and green colors shows what I expect to happen based on the data.
The chart below shows the percentages collected for this experiment.
DISCLAIMER:
Please note I am only providing my own trading information for your benefit and insight to my trading techniques, you should do your own due diligence and not take this information as a trade signal.

Creator of DepthHouse Indicators on TradingView!
↣ depthhouse.com/
↣ depthhouse.com/
相關出版品
免責聲明
這些資訊和出版物並非旨在提供,也不構成TradingView提供或認可的任何形式的財務、投資、交易或其他類型的建議或推薦。請閱讀使用條款以了解更多資訊。
Creator of DepthHouse Indicators on TradingView!
↣ depthhouse.com/
↣ depthhouse.com/
相關出版品
免責聲明
這些資訊和出版物並非旨在提供,也不構成TradingView提供或認可的任何形式的財務、投資、交易或其他類型的建議或推薦。請閱讀使用條款以了解更多資訊。