
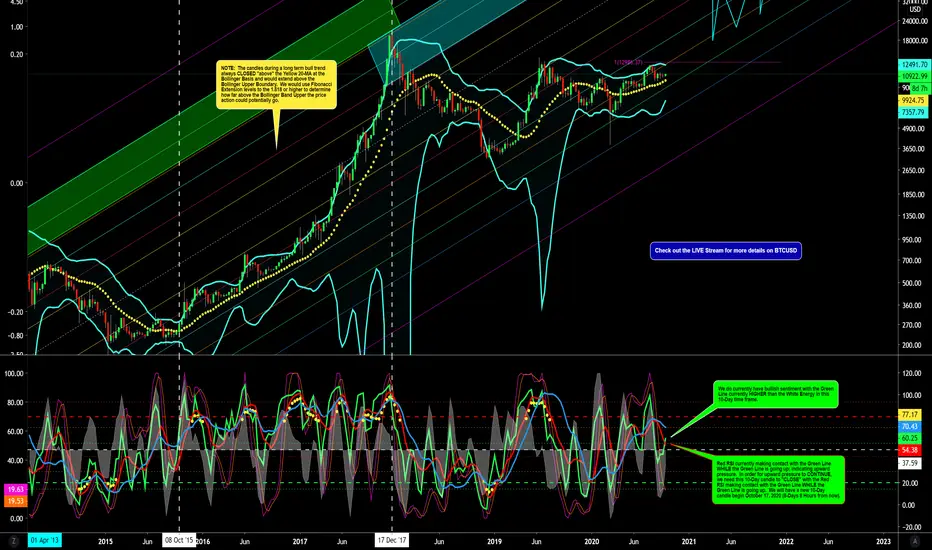
...Current 10-Day Candle CLOSES on October 17, 2020. Have a look at the 10-Day chart again below. The chart above may be scrunched up by TradingView's platform. I will follow up with another chart (5-Day) to add a few more additional comments.

註釋
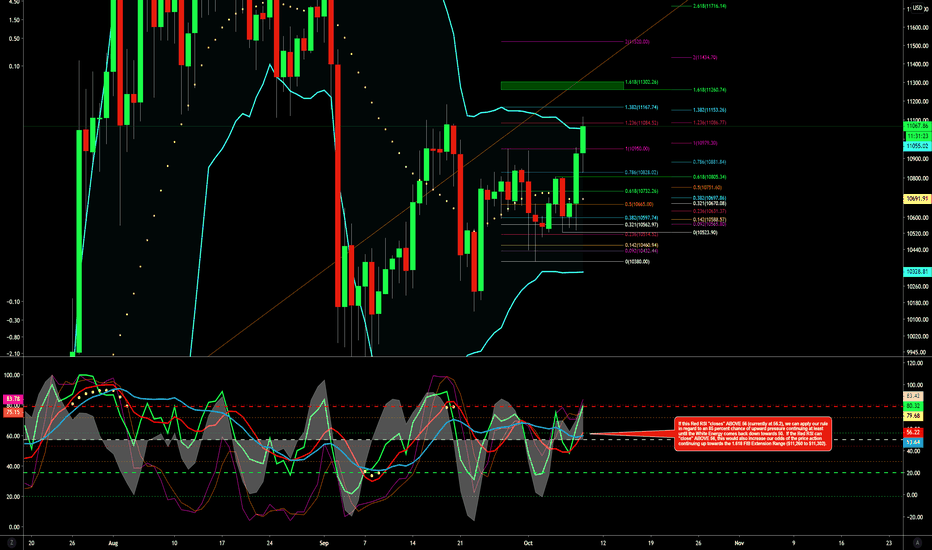
UPDATE:We were currently in a race between the White Energy in the 5-Day and Red RSI in the 10-Day. It's currently looking like the White Energy in the 5-Day will CLOSE above 50 "before" the Red RSI in the 10-Day can CROSS "below" 50. In which case, this is a signal for downward pressure likely coming to a close and transitioning to upward pressure. TO CONFIRM this transition to sustained upward pressure, we want to see the Green Line go HIGHER than the White Energy in the Daily, 2-Day, 3-Day and 4-Day and REMAIN higher than the Energy for a while.
BELOW is a look at the Green Line and White Energy in the 24 Hour, 3-Day and 5-Day Time Frames:
註釋
UPDATE:90 minute; 3 hour and 6 hour time frames:
註釋
UPDATE:12 hour time frame:
註釋
UPDATE:Additional notes on the Bollinger Bands in the 24h and 3-Day time frames:
註釋
UPDATE:An additional note for the Daily Phoenix 1.119 indicator:
註釋
UPDATE:Let's see where she goes... ; )
註釋

免責聲明
這些資訊和出版物並非旨在提供,也不構成TradingView提供或認可的任何形式的財務、投資、交易或其他類型的建議或推薦。請閱讀使用條款以了解更多資訊。
免責聲明
這些資訊和出版物並非旨在提供,也不構成TradingView提供或認可的任何形式的財務、投資、交易或其他類型的建議或推薦。請閱讀使用條款以了解更多資訊。