
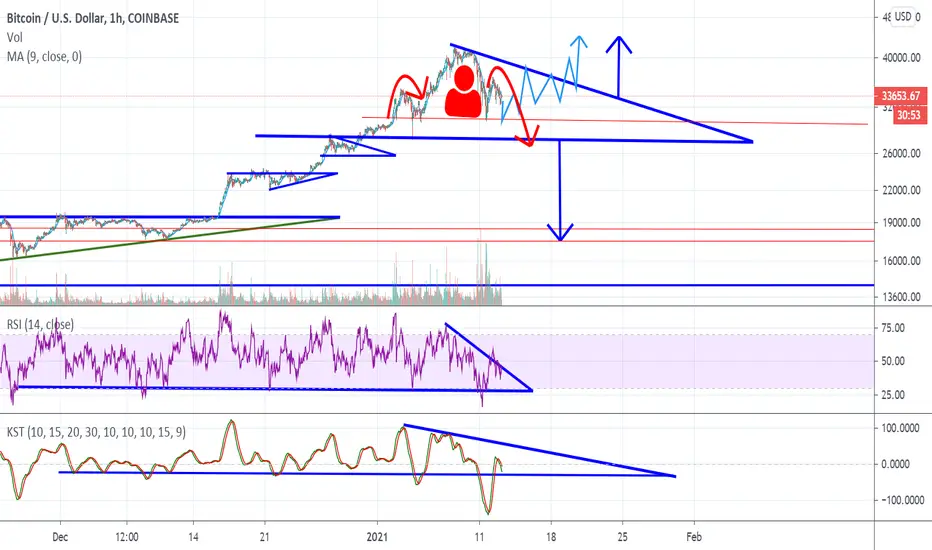
Bitcoin is potentially forming a giant H&S pattern inside of a larger Descending Triangle or Bullish Flag.
In light blue, I have drawn a hypothetical price scenario.
The RSI is breaking the downward sloping resistance of a descending triangle formation.
The KST saw a sharp deviation but has since found itself back into what could turn out as a bull flag or descending triangle.
In Dark Red inside the price pattern is potentially an H&S pattern.
In light blue, I have drawn a hypothetical price scenario.
The RSI is breaking the downward sloping resistance of a descending triangle formation.
The KST saw a sharp deviation but has since found itself back into what could turn out as a bull flag or descending triangle.
In Dark Red inside the price pattern is potentially an H&S pattern.
註釋
Bullish cross now apparent on the KST, updated chart here.. 

免責聲明
這些資訊和出版物並非旨在提供,也不構成TradingView提供或認可的任何形式的財務、投資、交易或其他類型的建議或推薦。請閱讀使用條款以了解更多資訊。