
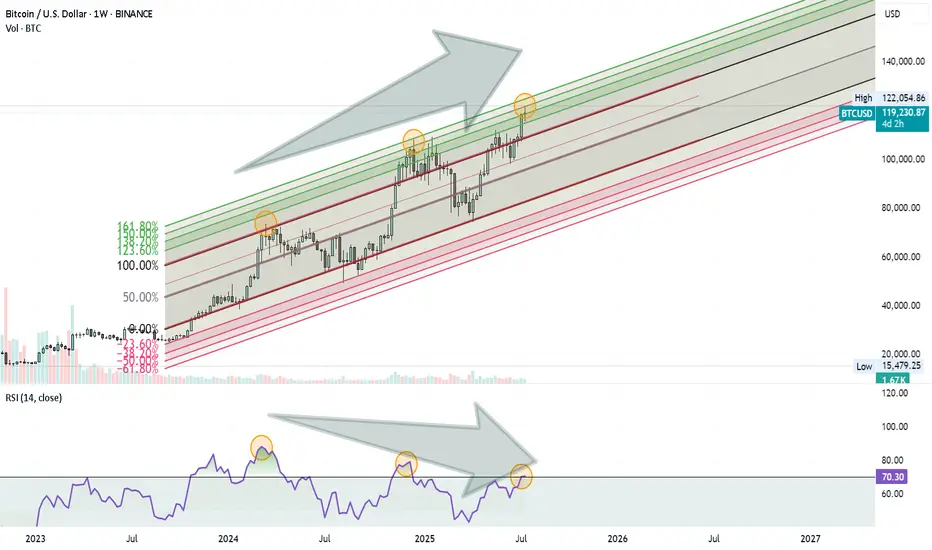
Bitcoin might be approaching a Turning Point. Here’s what I’m seeing on the weekly chart:
- Price is moving inside an ascending Fibonacci channel.
- It’s getting close to the 1.60 (160%) extension level, which has acted as a reversal zone before.
- At the same time, the RSI is showing a clear negative divergence, suggesting that momentum is weakening.
These signs combined could mean we’re not far from a significant correction.
Nothing is confirmed yet, but it’s a setup worth keeping an eye on.

相關出版品
免責聲明
這些資訊和出版物並非旨在提供,也不構成TradingView提供或認可的任何形式的財務、投資、交易或其他類型的建議或推薦。請閱讀使用條款以了解更多資訊。