Recently noticed a pattern in the charts.
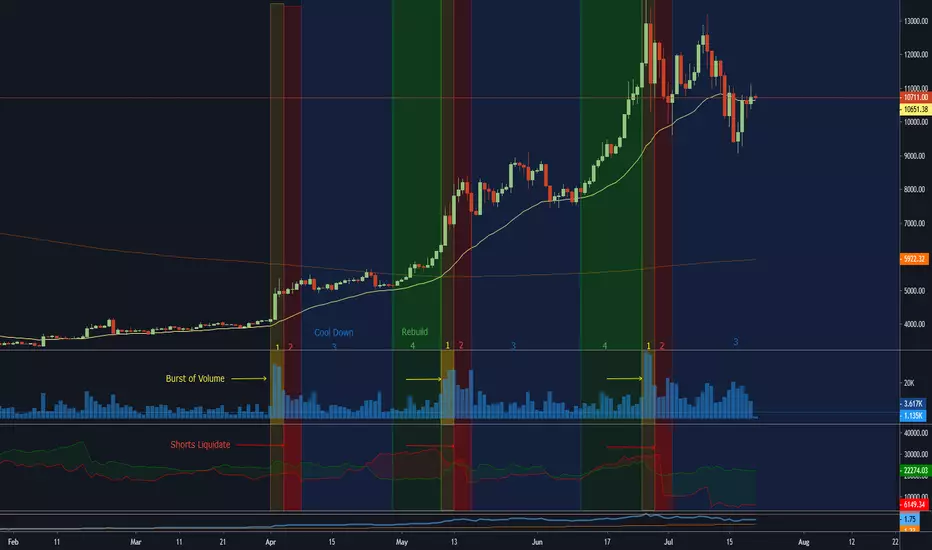
The third chart is a piece of pine script I wrote to help visualize BTCUSDSHORTS and BTCUSDLONGS.
A drop in open shorts has been preceded by large volume pushing the price higher, likely into many stops, continuing the rally.

As you can see, after the action has cooled down price, will move to the 30 day EMA before it picks up again. Except for this last time. Price plunged under the 30 day EMA before it snapped back to the EMA. Also, the amount of open shorts on Bitfinex is the lowest its been.

This leads me to believe the cool down period will last longer than the previous ones.
The third chart is a piece of pine script I wrote to help visualize
BTCUSDSHORTS and BTCUSDLONGS. A drop in open shorts has been preceded by large volume pushing the price higher, likely into many stops, continuing the rally.
As you can see, after the action has cooled down price, will move to the 30 day EMA before it picks up again. Except for this last time. Price plunged under the 30 day EMA before it snapped back to the EMA. Also, the amount of open shorts on Bitfinex is the lowest its been.
This leads me to believe the cool down period will last longer than the previous ones.

免責聲明
這些資訊和出版物並非旨在提供,也不構成TradingView提供或認可的任何形式的財務、投資、交易或其他類型的建議或推薦。請閱讀使用條款以了解更多資訊。
免責聲明
這些資訊和出版物並非旨在提供,也不構成TradingView提供或認可的任何形式的財務、投資、交易或其他類型的建議或推薦。請閱讀使用條款以了解更多資訊。