
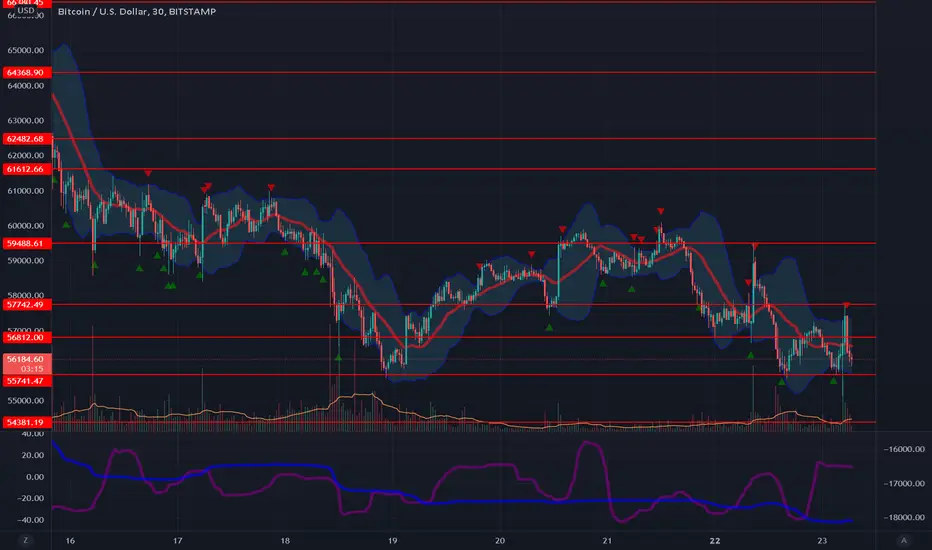
Bitcoin has refused any attempt at a bull rally, with sharp two-bar candlestick rejection patterns on the 30 min chart with every time the price moves higher. It has been smacked down from $59.8K, the next level under $60K, then again at $57.7K. We are seeing good support from $57.7K as identified by two green triangles on the KRI. The Kovach OBV is steadily and consistently bearish, suggesting that the selloff may continue. If so, we should have further support from $54.3K. If not, we must break $57.7K, then $60K to be considered 'bullish' again.

Join my discord at discord.io/quantguy
相關出版品
免責聲明
這些資訊和出版物並非旨在提供,也不構成TradingView提供或認可的任何形式的財務、投資、交易或其他類型的建議或推薦。請閱讀使用條款以了解更多資訊。
Join my discord at discord.io/quantguy
相關出版品
免責聲明
這些資訊和出版物並非旨在提供,也不構成TradingView提供或認可的任何形式的財務、投資、交易或其他類型的建議或推薦。請閱讀使用條款以了解更多資訊。