
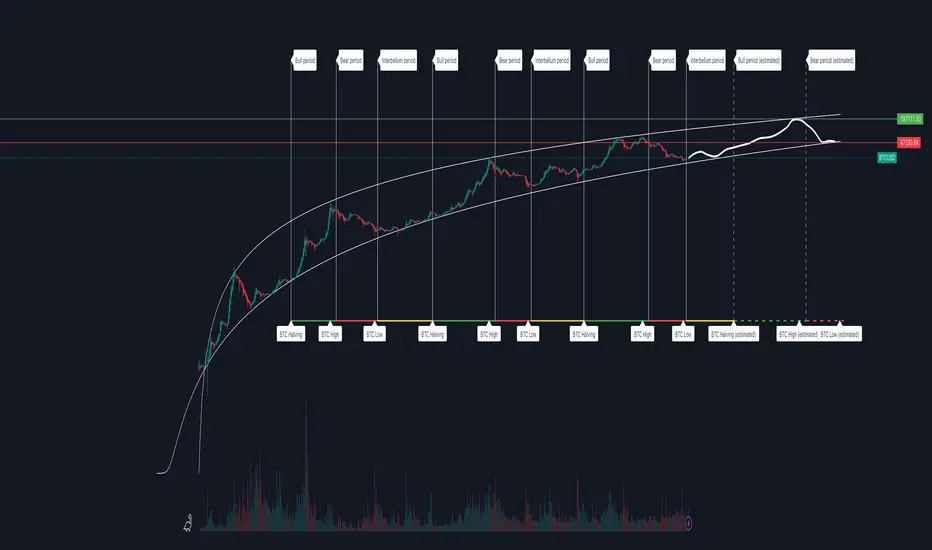
I wrote a script that marks the bear/interbellum/bull periods.. and found two logarithmic functions that mark the historical tops/bottoms... next bull top 200k.. next bear bottom 47k. Interbellum 3x fluctuations range.

免責聲明
這些資訊和出版物並非旨在提供,也不構成TradingView提供或認可的任何形式的財務、投資、交易或其他類型的建議或推薦。請閱讀使用條款以了解更多資訊。