
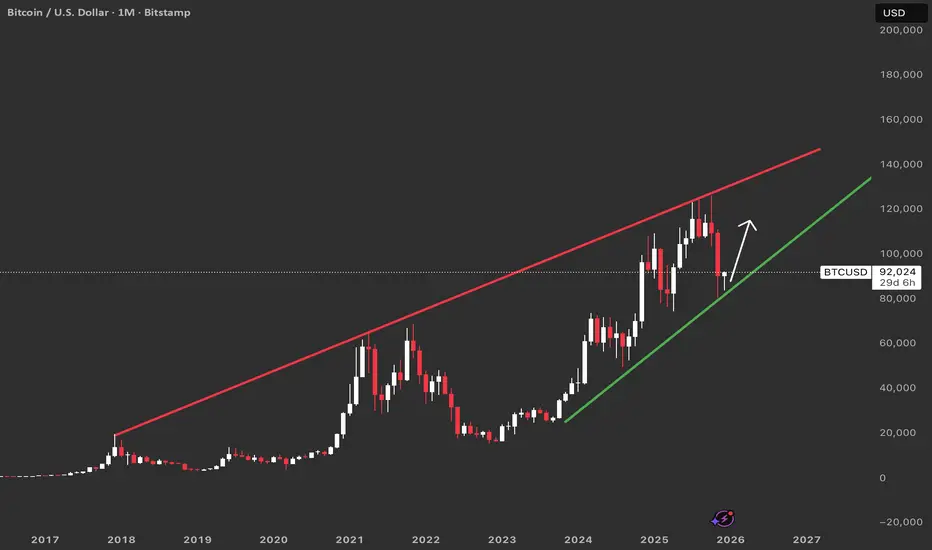
This monthly Bitcoin chart is on an arithmetic scale. The red line marks macro resistance connecting the major cycle peaks since 2017, forming the upper boundary of a large rising wedge, while the green line tracks macro support from the 2022 bear‑market low.
Price has recently pulled back from near the resistance and is now reacting around the support, showing that this trend channel is still respected on a closing‑basis. As long as monthly candles hold above the green line, the primary uptrend from the last bear‑market bottom remains intact and the wedge structure continues to guide expectations.
From this perspective, the chart suggests a path where Bitcoin can bounce off macro support and travel once more toward the resistance line before a larger cycle top and subsequent bear market.
This aligns with my main strategy that calls for a new high before the next major downturn.
Price has recently pulled back from near the resistance and is now reacting around the support, showing that this trend channel is still respected on a closing‑basis. As long as monthly candles hold above the green line, the primary uptrend from the last bear‑market bottom remains intact and the wedge structure continues to guide expectations.
From this perspective, the chart suggests a path where Bitcoin can bounce off macro support and travel once more toward the resistance line before a larger cycle top and subsequent bear market.
This aligns with my main strategy that calls for a new high before the next major downturn.

免責聲明
這些資訊和出版物並非旨在提供,也不構成TradingView提供或認可的任何形式的財務、投資、交易或其他類型的建議或推薦。請閱讀使用條款以了解更多資訊。
免責聲明
這些資訊和出版物並非旨在提供,也不構成TradingView提供或認可的任何形式的財務、投資、交易或其他類型的建議或推薦。請閱讀使用條款以了解更多資訊。