
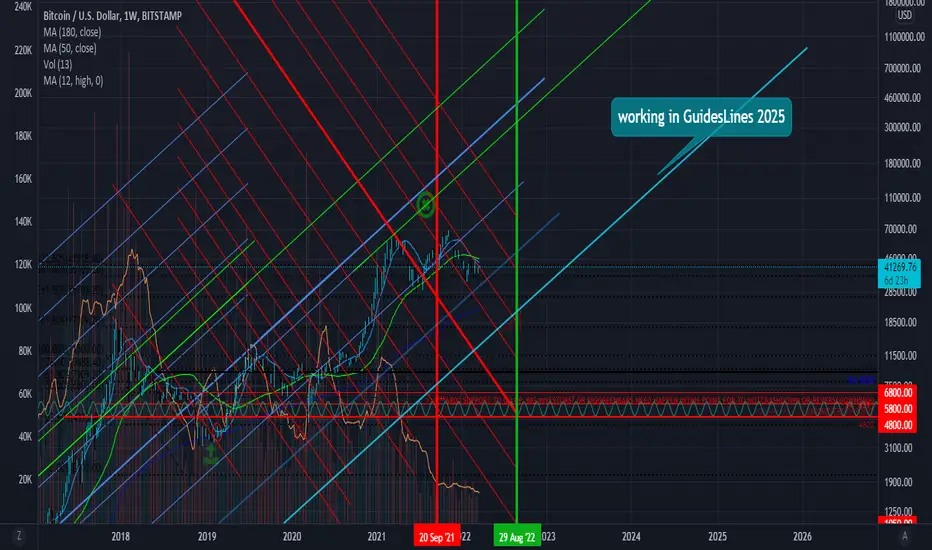
im thinkink about two possibles trends up to 2025 building the guides line in fibolevels, but, find fibo level for future is almost impossible, but is not impossible.
註釋
I See Strong Pivot formation at40k by buyer Volume around 40k, its important detail about fibolines>>> i.ibb.co/8NpLMFs/image.png註釋
i made this at 2020, and hit. the Xtarget>>> tradingview.com/chart/BTCUSD/sgacx7B4-x-is-target/註釋
in this ...iWorryAbout24K.Resistance>>> 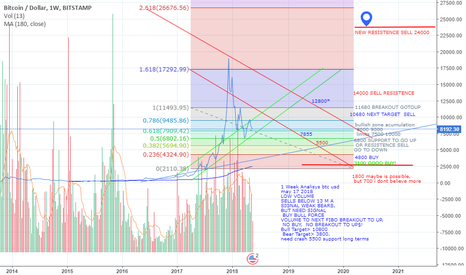
註釋
ate daily chart, we could see more details over close daily candles 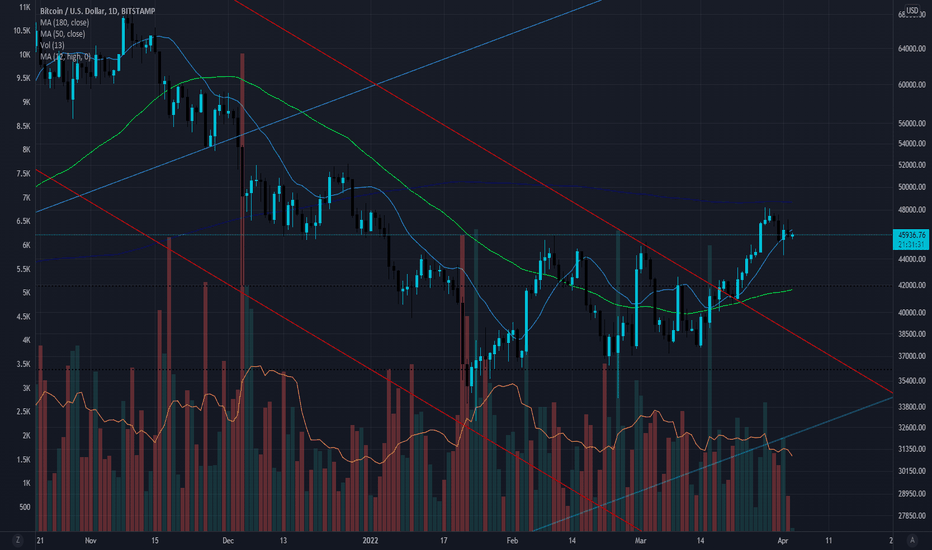
註釋
by Now, is, Clear for Awhile...註釋
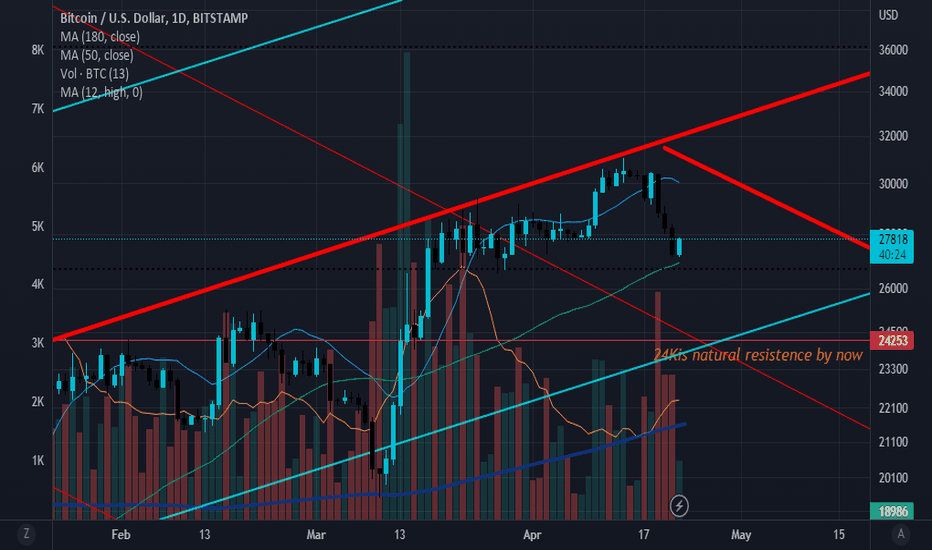
24Kis natural resistence by now註釋
On Daily chart, btc broke the 'down channel to up and could get to new up chanel, , if 24k are strong, the price can go down again, and could stop on up line from down chanel next... 12k...or up after resistance, is 30k.on down line from latest up chanel drawed in blue... its possible for new 6months...>> 註釋
If not break 24 K, could back for 20 to test suport.. only fast test is possible, if pass on test, back to 24, 26 30. 註釋
By Now, i build a new blue line suport base to go up, and if, broke 24k resistance and hold the price above for an month, i think the price could go for 34k....like an knife >>> 註釋
WHAt s The next ???, the price was hard when it climbing for 28k, and ii think is open for reach 34, but dont could close bellow of 18500 on end this month, >>> 註釋
註釋
註釋
is uncyntonized, daily candles to long time print for see trend from fibo retracements levels on original retracemet from this chart //trend, (17200)161.80%line from fibo this retracemet"0%"is2100, 50%is6800, 100% is 11500, . is interestant an retracement from 11500 to 3000, for see micro level for draw new sub-lines,using this to try predict the future price or contact with lines up or down line... and predict the time with vertical lines, how likered ang light-green vertical lights, predicting the time, saw in ,my previous charts published....is passtimee drw line for futures trends....>>>> 註釋
註釋
medium lines for long times&trends, following red and blue lines... 註釋
This is an 'secret chart idea for theses that are following this idea, Thanks!!!, new lines 'Hig resistances for next times. 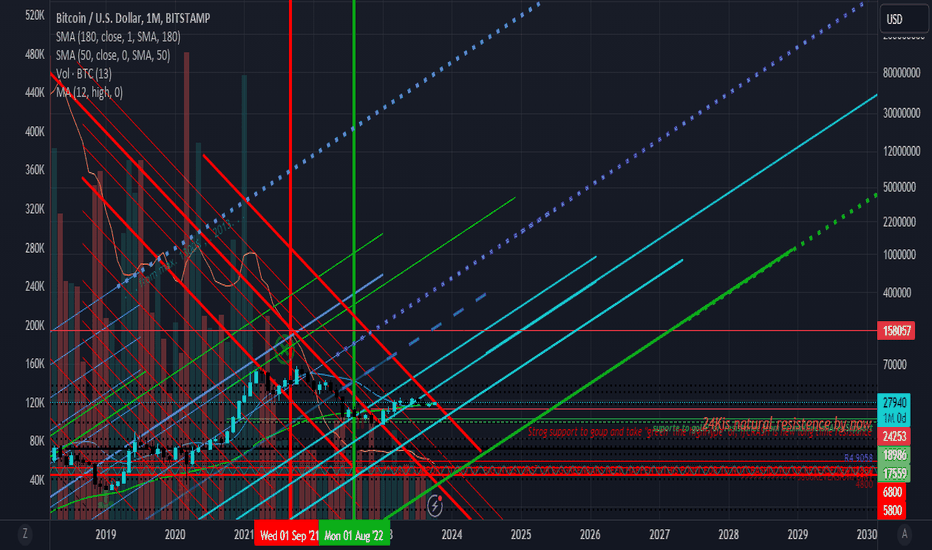
註釋
print of weeky chart , in low trend by moves lines, 180 over 50ma, if was 50 over 189 ma we will be in bull trend, but no, we no are in bull trend on weekly chart, 註釋
hype green lineadd, and two second down red lines

免責聲明
這些資訊和出版物並非旨在提供,也不構成TradingView提供或認可的任何形式的財務、投資、交易或其他類型的建議或推薦。請閱讀使用條款以了解更多資訊。
免責聲明
這些資訊和出版物並非旨在提供,也不構成TradingView提供或認可的任何形式的財務、投資、交易或其他類型的建議或推薦。請閱讀使用條款以了解更多資訊。