
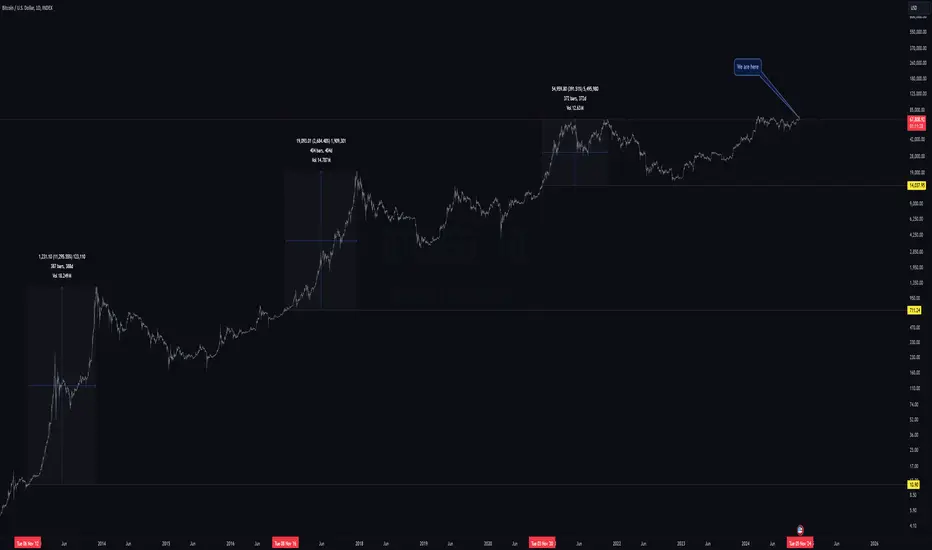
This charts the dates of the previous three US Elections (2012, 2016 and 2020) on a log chart, with price on the horizontal axis at daily candle close.
As you can see, once price breaks above (sometimes next day, as in 2020, sometimes a week or more later, as in 2016 and in 2012) price has never returned - ever.
Plotted are the time and percentage difference from election date to cycle ATH. On average it's 387 days apart.
If things play out this time in a similar fashion we can expect this week into mid next week to be the final time BTC will be in the mid 60k per coin - ever.
As you can see, once price breaks above (sometimes next day, as in 2020, sometimes a week or more later, as in 2016 and in 2012) price has never returned - ever.
Plotted are the time and percentage difference from election date to cycle ATH. On average it's 387 days apart.
If things play out this time in a similar fashion we can expect this week into mid next week to be the final time BTC will be in the mid 60k per coin - ever.

免責聲明
這些資訊和出版物並非旨在提供,也不構成TradingView提供或認可的任何形式的財務、投資、交易或其他類型的建議或推薦。請閱讀使用條款以了解更多資訊。