
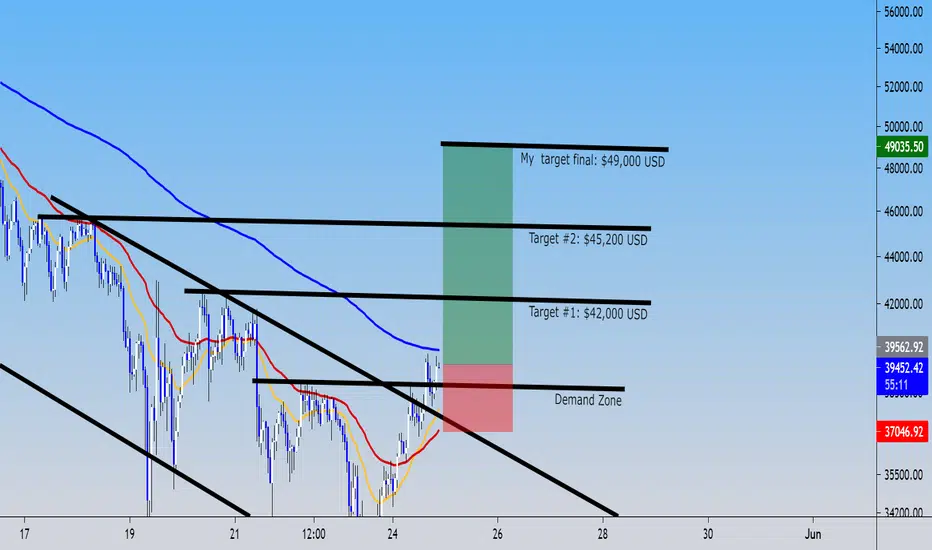
In this chart, we see that Bitcoin broke up this bullish flag; reversal pattern. So, that mean that Bitcoin have al chances to continue up in this week to $49,000 USD, my target profit.
s3.tradingview.com/snapshots/g/gm1zyMmH.png
This it's the H4 timeframe and the chartist pattern that I said: the bullish flag!!!
So guys, in my other analysis of bear market, will be closed up inmediately as Bitcoin continue up and get some profit of the short position, then, you can to entry right now in H1 timeframe and put the SL at $37,000 USD and consider these targets to reach in this up in this beautiful trade.
Good luck!!!
s3.tradingview.com/snapshots/g/gm1zyMmH.png
This it's the H4 timeframe and the chartist pattern that I said: the bullish flag!!!
So guys, in my other analysis of bear market, will be closed up inmediately as Bitcoin continue up and get some profit of the short position, then, you can to entry right now in H1 timeframe and put the SL at $37,000 USD and consider these targets to reach in this up in this beautiful trade.
Good luck!!!
交易結束:達到停損點
Bitcoin touch our SL, but it´s still bullish, but we see that form a shoulder head shoulder.
免責聲明
這些資訊和出版物並非旨在提供,也不構成TradingView提供或認可的任何形式的財務、投資、交易或其他類型的建議或推薦。請閱讀使用條款以了解更多資訊。
免責聲明
這些資訊和出版物並非旨在提供,也不構成TradingView提供或認可的任何形式的財務、投資、交易或其他類型的建議或推薦。請閱讀使用條款以了解更多資訊。