
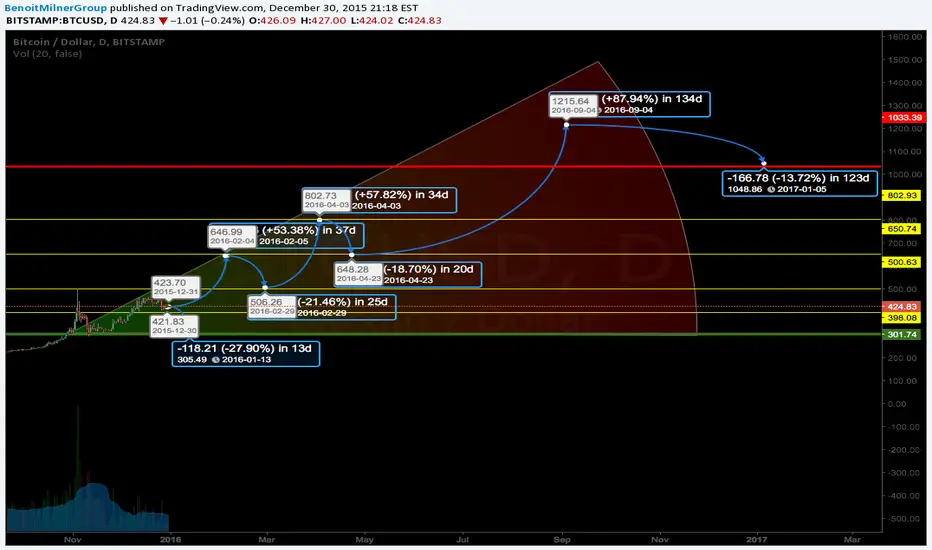
This is our Year Long Structure. If we see a break below $300 during the year the we should expect further selling but
We expect to see a gradual rise back to $1200 during 2016
The yellow lines represent "Key Levels" which could act as a support or a resistance.
The red and green lines represent "Strong Support & Strong Resistance.
But this is another very good guideline for trading BTC in 2016.
Posting some short term BTC ideas for January.
Remember to follow and any questions just comment!
We expect to see a gradual rise back to $1200 during 2016
The yellow lines represent "Key Levels" which could act as a support or a resistance.
The red and green lines represent "Strong Support & Strong Resistance.
But this is another very good guideline for trading BTC in 2016.
Posting some short term BTC ideas for January.
Remember to follow and any questions just comment!

免責聲明
這些資訊和出版物並非旨在提供,也不構成TradingView提供或認可的任何形式的財務、投資、交易或其他類型的建議或推薦。請閱讀使用條款以了解更多資訊。