
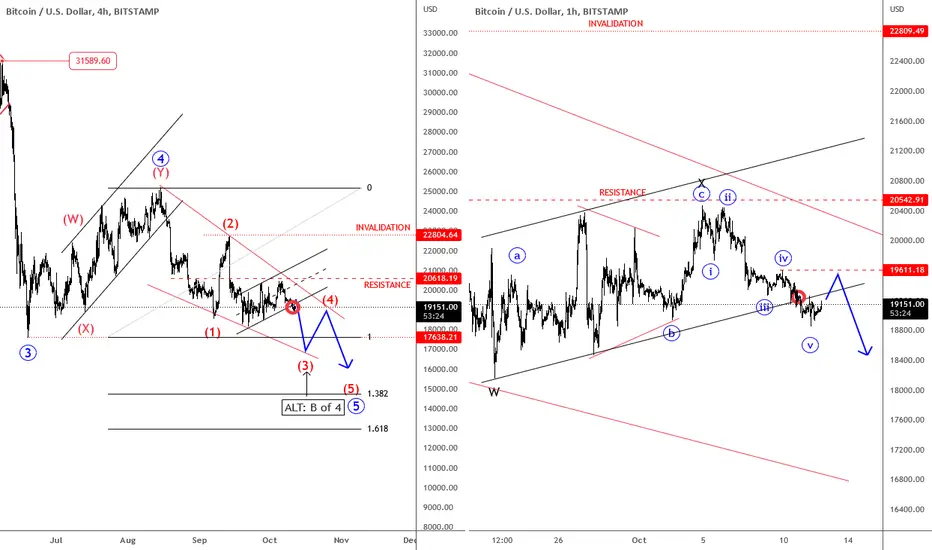
BTCUSD is coming sharply down in the 4-hour chart and seems like it's going to retest June lows within 5th wave after the recent complex corrective structure in wave 4. So, watch out for more weakness towards 17k-12k area, but maybe within a slower price action as part of the ending diagonal pattern for wave 5, unless it alternatively stays sideways within wave 4 bearish triangle formation.
On the hourly chart, we can also see five waves down from 20.600 resistance area, which suggests more downside in the near future, after any short-term rally.
On the hourly chart, we can also see five waves down from 20.600 resistance area, which suggests more downside in the near future, after any short-term rally.

Get the full Elliott Wave counts at WaveTraders, 14 days trial >> @ wavetraders.com/
Learn Elliott Waves Sale-65%
👉 wavetraders.com/academy/
Newsletter
👉 bit.ly/3FVPVzO
Learn Elliott Waves Sale-65%
👉 wavetraders.com/academy/
Newsletter
👉 bit.ly/3FVPVzO
相關出版品
免責聲明
這些資訊和出版物並非旨在提供,也不構成TradingView提供或認可的任何形式的財務、投資、交易或其他類型的建議或推薦。請閱讀使用條款以了解更多資訊。
Get the full Elliott Wave counts at WaveTraders, 14 days trial >> @ wavetraders.com/
Learn Elliott Waves Sale-65%
👉 wavetraders.com/academy/
Newsletter
👉 bit.ly/3FVPVzO
Learn Elliott Waves Sale-65%
👉 wavetraders.com/academy/
Newsletter
👉 bit.ly/3FVPVzO
相關出版品
免責聲明
這些資訊和出版物並非旨在提供,也不構成TradingView提供或認可的任何形式的財務、投資、交易或其他類型的建議或推薦。請閱讀使用條款以了解更多資訊。