
Look at the monthly timeframe
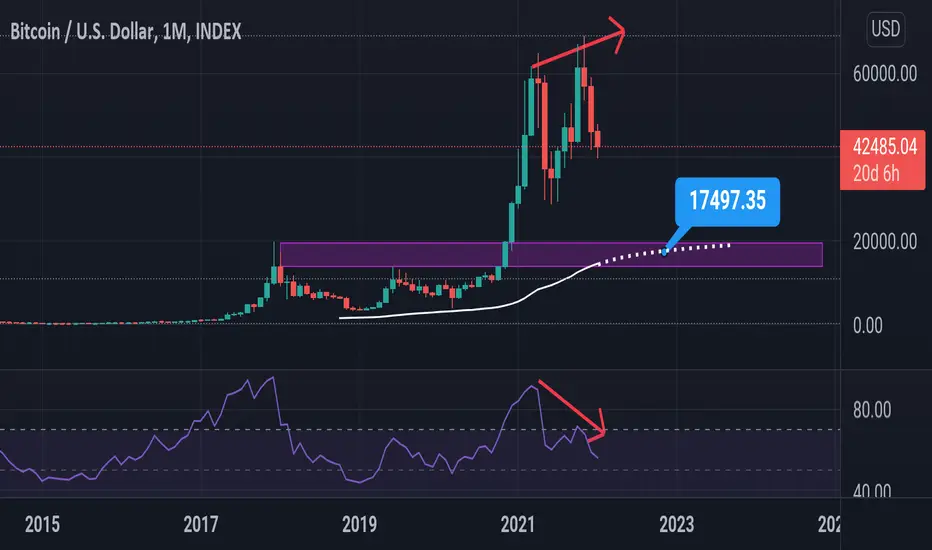
What do you see? Higher timeframes never lie and they're very simple to understand! We see a double top around 60_70K which is a very strong resistance also we see a bearish divergence because as price making higher highs RSI making lower highs also RSI is overbought. There's a support around 18_13K and also 100 monthly EMA is exactly there to support the price in future. These are very simple and obvious. Now you look at the chart and tell me what do you expect from bitcoin?
What do you see? Higher timeframes never lie and they're very simple to understand! We see a double top around 60_70K which is a very strong resistance also we see a bearish divergence because as price making higher highs RSI making lower highs also RSI is overbought. There's a support around 18_13K and also 100 monthly EMA is exactly there to support the price in future. These are very simple and obvious. Now you look at the chart and tell me what do you expect from bitcoin?
註釋
As you see guys higher timeframes never lie. When we're bearish in higher timeframes it means indeed we're bearish in longterm.17K is in sight.

免責聲明
這些資訊和出版物並非旨在提供,也不構成TradingView提供或認可的任何形式的財務、投資、交易或其他類型的建議或推薦。請閱讀使用條款以了解更多資訊。