
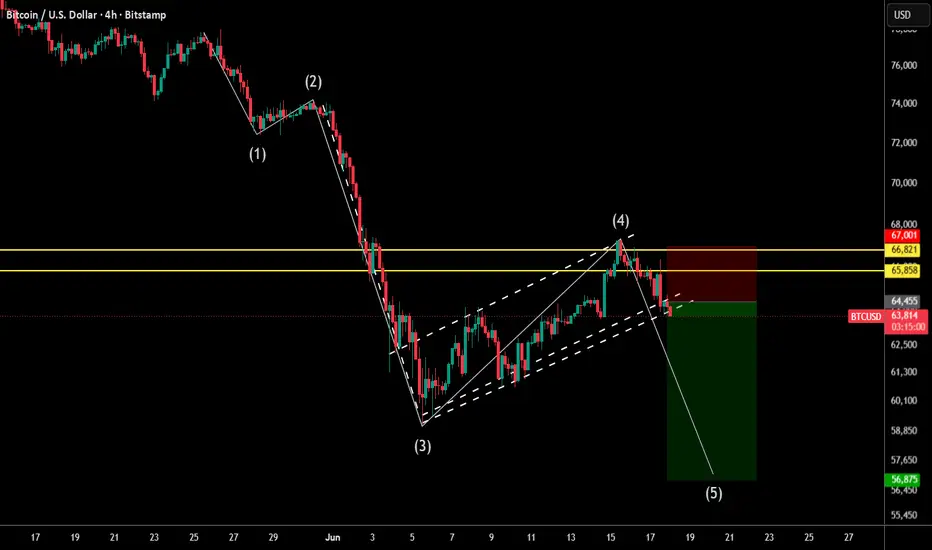
The recent price action in Bitcoin can be interpreted through an Elliott Wave framework, where the market appears to be developing a five-wave impulsive sequence to the downside.
The initial decline from the late-May highs can be labeled as Wave (1), followed by a corrective Wave (2) retracement. The subsequent selloff into the June lows represents an extended Wave (3), which is consistent with Elliott Wave theory, as third waves tend to be the strongest and most directional portion of the trend.
Following the Wave (3) low, BTC entered a corrective recovery phase that unfolded within a rising channel, culminating near the $66,000–$67,000 resistance zone. This rebound appears consistent with a developing Wave (4) correction, which has now encountered significant overhead supply and failed to reclaim key resistance levels.
More importantly, price is beginning to break below the lower boundary of the corrective structure, suggesting that Wave (4) may have completed. If this interpretation is correct, the market could be entering Wave (5), the final impulsive leg of the sequence.
Under this scenario, a sustained break below the $63,500–$64,000 support zone would likely accelerate downside momentum, opening the path toward the $57,000 region, which aligns with both prior support and the projected target derived from the wave structure.

免責聲明
這些資訊和出版物並非旨在提供,也不構成TradingView提供或認可的任何形式的財務、投資、交易或其他類型的建議或推薦。請閱讀使用條款以了解更多資訊。