
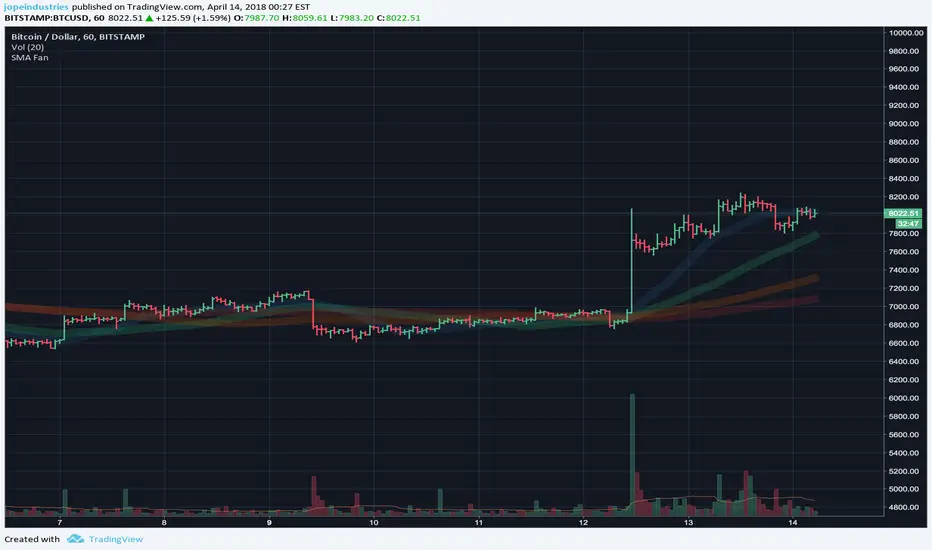
Notice that the SMAs have reconciled to their normal uptrend position in the hourly charts.
Watch for the SMA(20) to cross under the SMA(50) as a cue for a reversal to the downside.
Look for continuation of the nascent uptrend if this pattern spreads to the 2-hour, 4-hour and daily charts.
Watch for the SMA(20) to cross under the SMA(50) as a cue for a reversal to the downside.
Look for continuation of the nascent uptrend if this pattern spreads to the 2-hour, 4-hour and daily charts.
註釋
The 2-hour chart appears to have just crossed up. The 4-hour bars still have a way to go.註釋
Happily, order is restored in the 1-day bar interval chart now.註釋
Whoops, ignore that last update. My chart settings reset.Still watching the 4-hour bars to see if the trend continues.

免責聲明
這些資訊和出版物並非旨在提供,也不構成TradingView提供或認可的任何形式的財務、投資、交易或其他類型的建議或推薦。請閱讀使用條款以了解更多資訊。
免責聲明
這些資訊和出版物並非旨在提供,也不構成TradingView提供或認可的任何形式的財務、投資、交易或其他類型的建議或推薦。請閱讀使用條款以了解更多資訊。