
My last update contained a short-term Triangle pattern setup with target area 1670-1689. The strategy I suggested was going long just above Wave D of Triangle with a stop-loss near Wave E bottom. 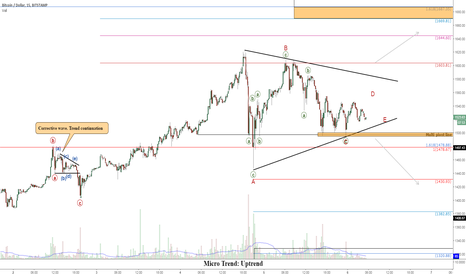
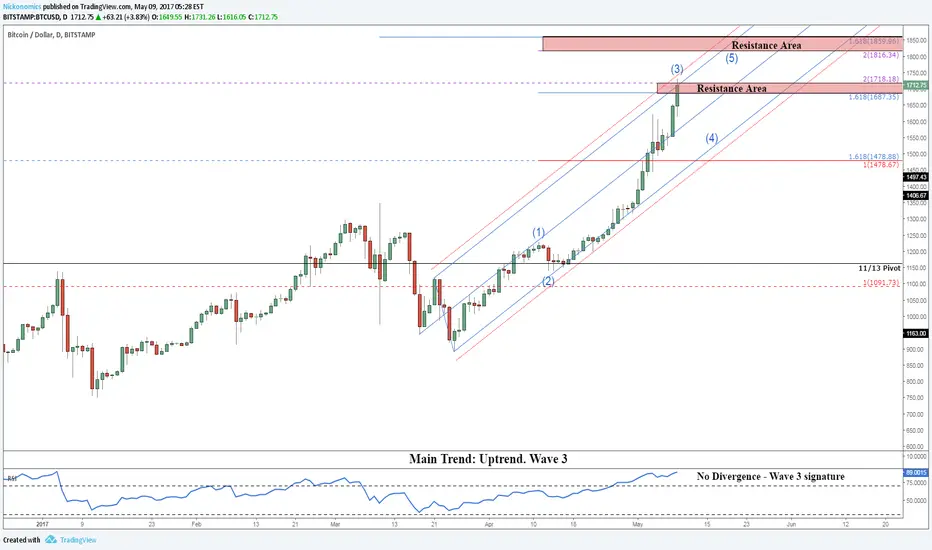
Everything went quite smoothly with prices breaking to $1720-s highs. Now it's time to switch to a longer-term chart and assess the trend pattern. According to my wave model, the price is still in Wave 3. Fibo ratios and no divergence RSI pattern support this idea. There are 2 resistance areas where this wave could end.
Intraday chart looks like this:
__
Video update: goo.gl/VZWlGH (Russian)
Everything went quite smoothly with prices breaking to $1720-s highs. Now it's time to switch to a longer-term chart and assess the trend pattern. According to my wave model, the price is still in Wave 3. Fibo ratios and no divergence RSI pattern support this idea. There are 2 resistance areas where this wave could end.
Intraday chart looks like this:
__
Video update: goo.gl/VZWlGH (Russian)
註釋
Alternative wave count:
相關出版品
免責聲明
這些資訊和出版物並非旨在提供,也不構成TradingView提供或認可的任何形式的財務、投資、交易或其他類型的建議或推薦。請閱讀使用條款以了解更多資訊。